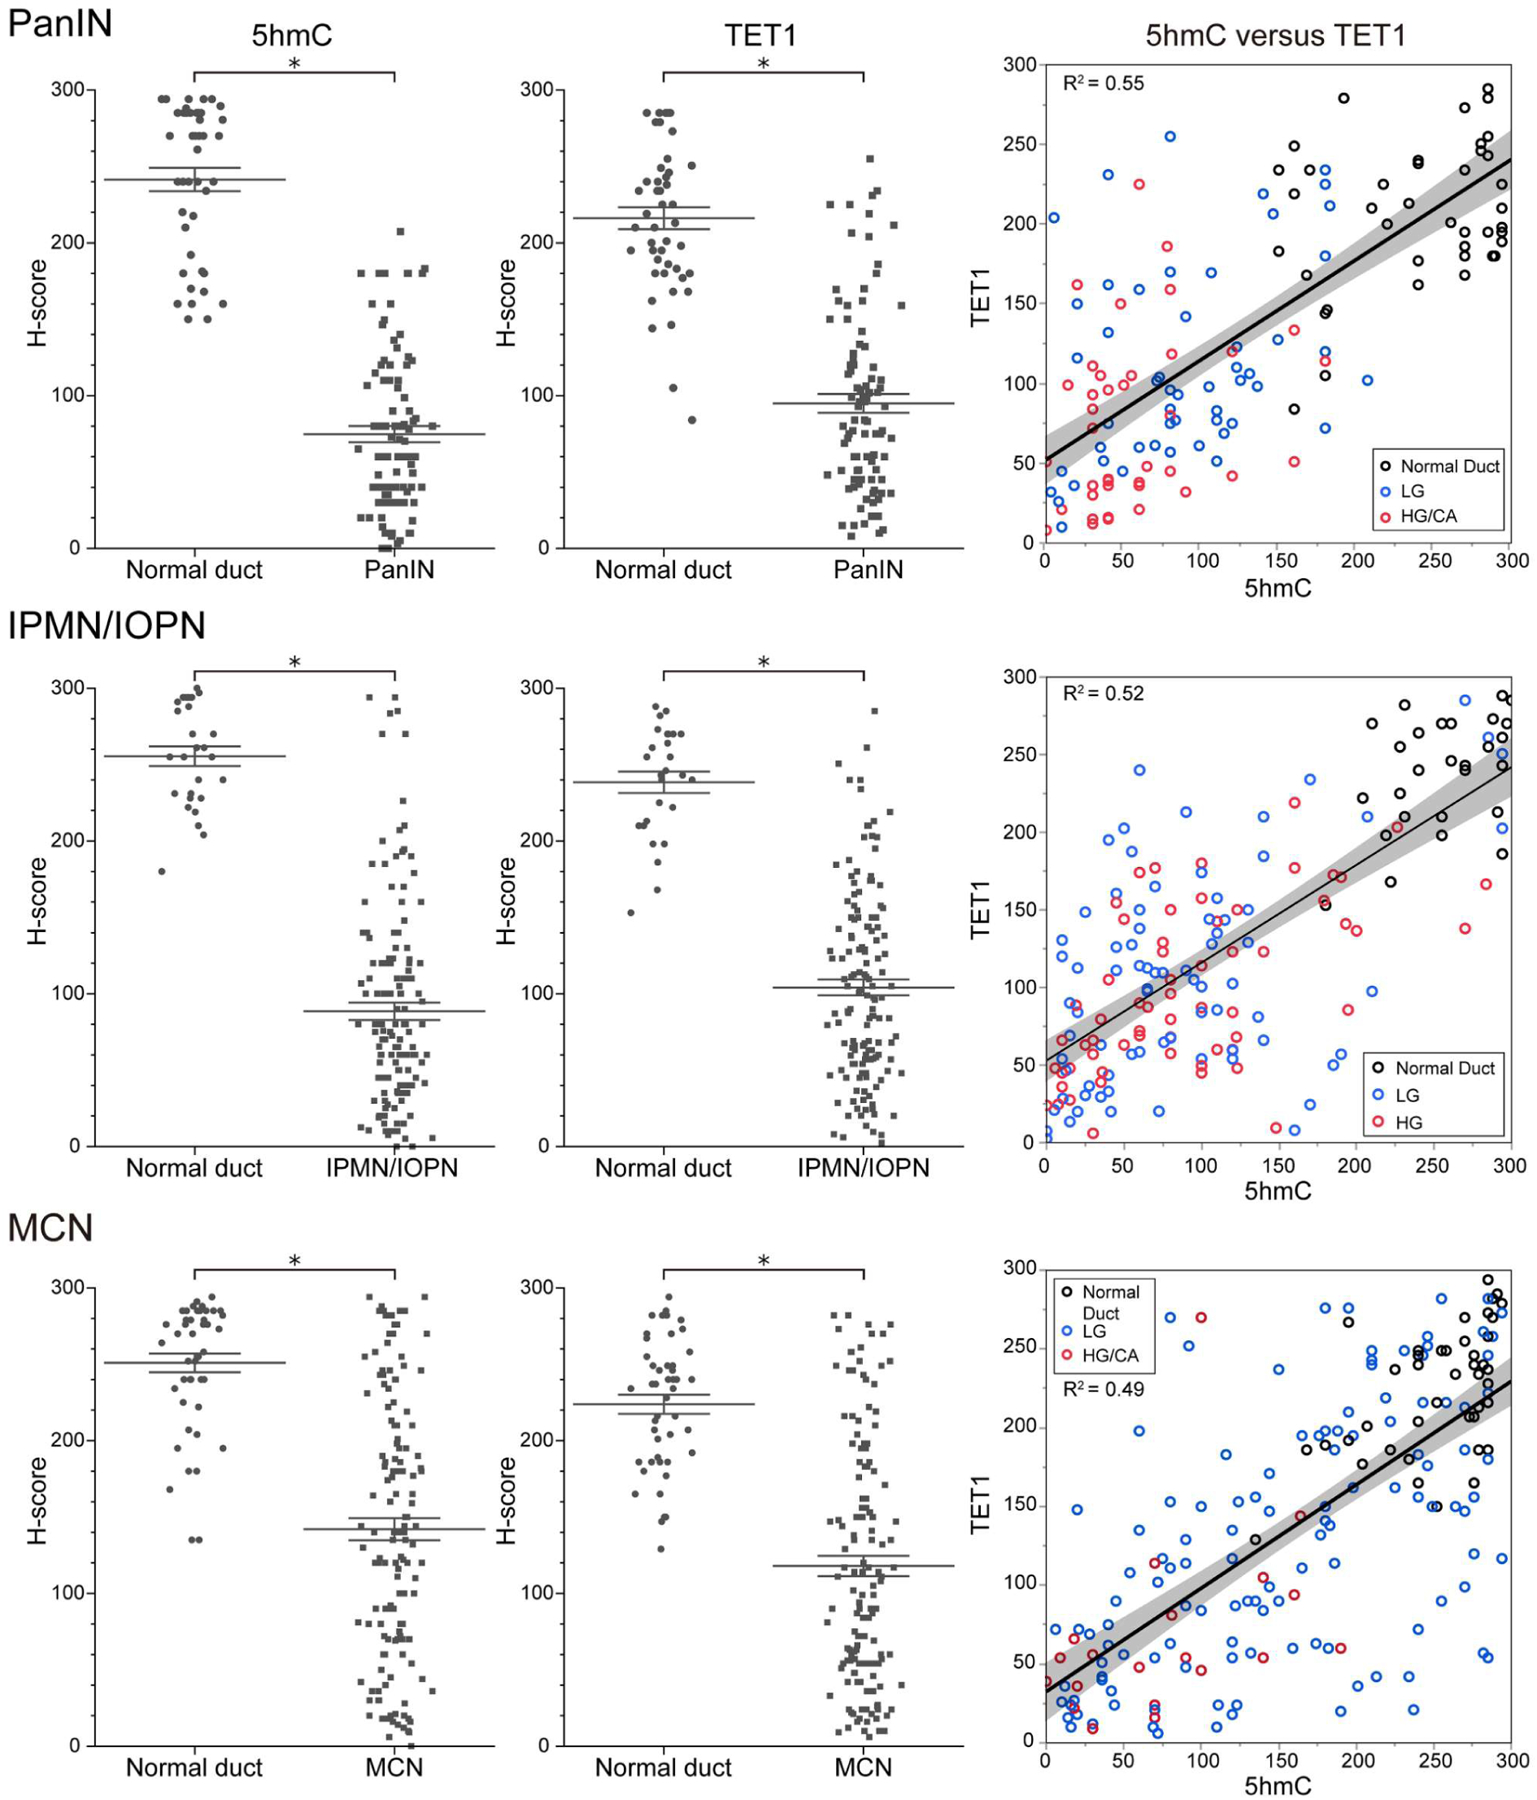
Figure 2.

Comparison of the extent of 5hmC and TET1 immunoreactivity in normal ducts versus precancerous lesions. Data are presented as scatter plots of H-scores (0–300) on PanIN slides (normal duct, n = 45; neoplasm, n = 95), IPMN/IOPN slides (normal duct, n = 27; neoplasm, n = 141), or MCN slides (normal duct, n = 46; neoplasm, n = 144). Lines and error bars indicate the mean and SEM, respectively. Correlation plots between 5hmC H-scores and TET1 H-scores are shown in the right-hand panels. Pearson’s correlation coefficients (R2) were calculated to analyze the correlation between TET1 and 5hmC levels. Black dot: normal duct; blue dot: low-grade lesion; red dot: high-grade (/carcinoma) lesion. When low-grade and high-grade lesions coexist on a slide, these two lesions usually have different H-scores and therefore are shown as two separate dots on the graph (see also Figure 4 for further analysis of patients with three matched regions, namely normal duct, low-grade lesion, and high-grade lesion from the same patient). Mann-Whitney U-test, *p < 0.001. H6, high grade; LG, low grade; CA, carcinoma.
