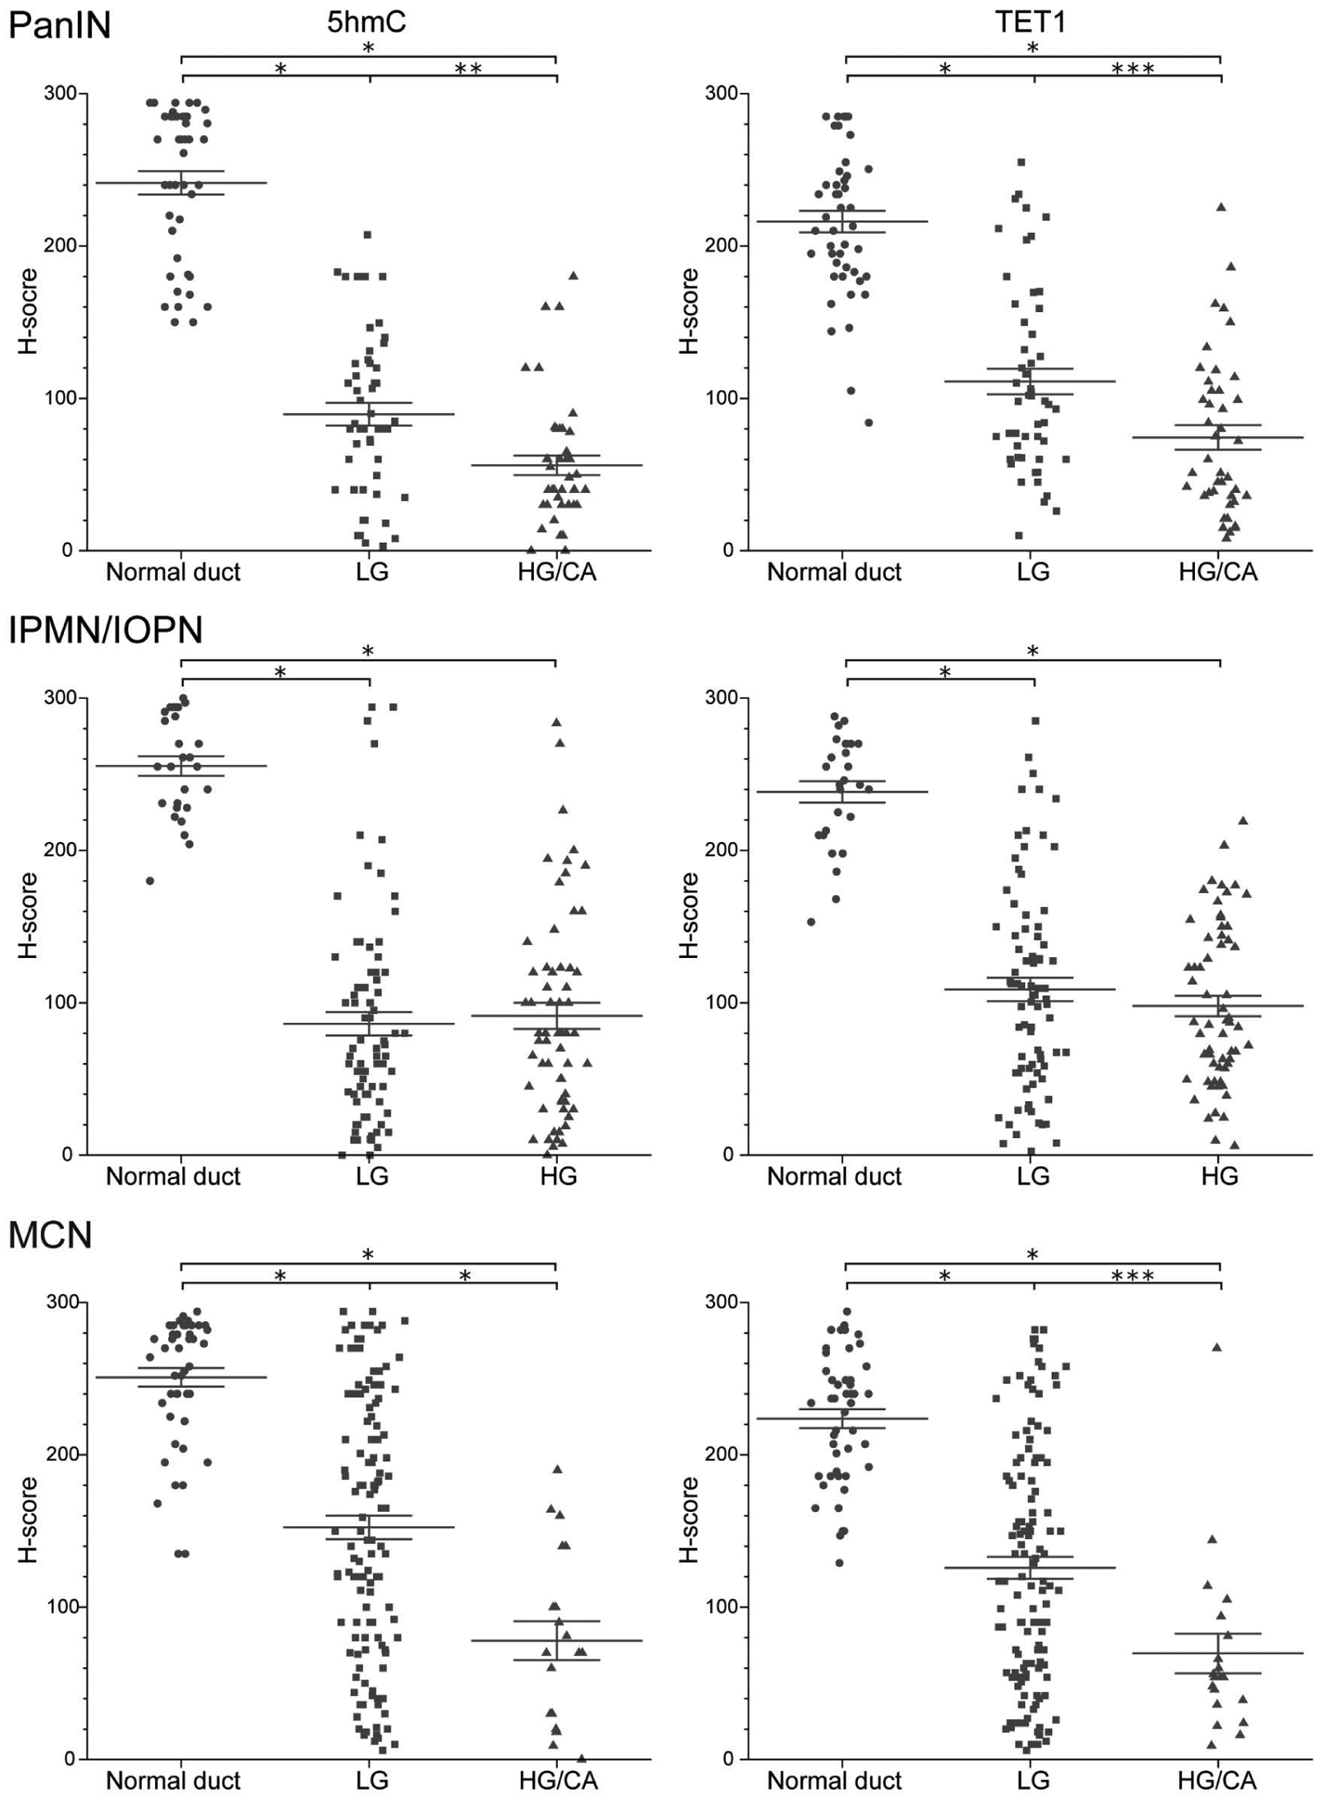
Figure 3.

Comparison of H-scores of 5hmC and TETI according to histological grade in three precancerous lesions. Data are presented as scatter plots of H-scores (0–300) on PanIN slides (normal duct, n = 45; low grade, n = 53; high grade/carcinoma, n = 42), IPMN/IOPN slides (normal duct, n = 27; low grade, n = 80; high grade, n = 61), or MCN slides (normal duct, n = 46; low grade, n = 124; high grade/carcinoma, n = 20). Lines and error bars indicate the mean and SEM, respectively. Mann-Whitney U-test, *p < 0.001, **p = 0.001, ***p = 0.002. HG, high grade; LG, low grade; CA, carcinoma.
