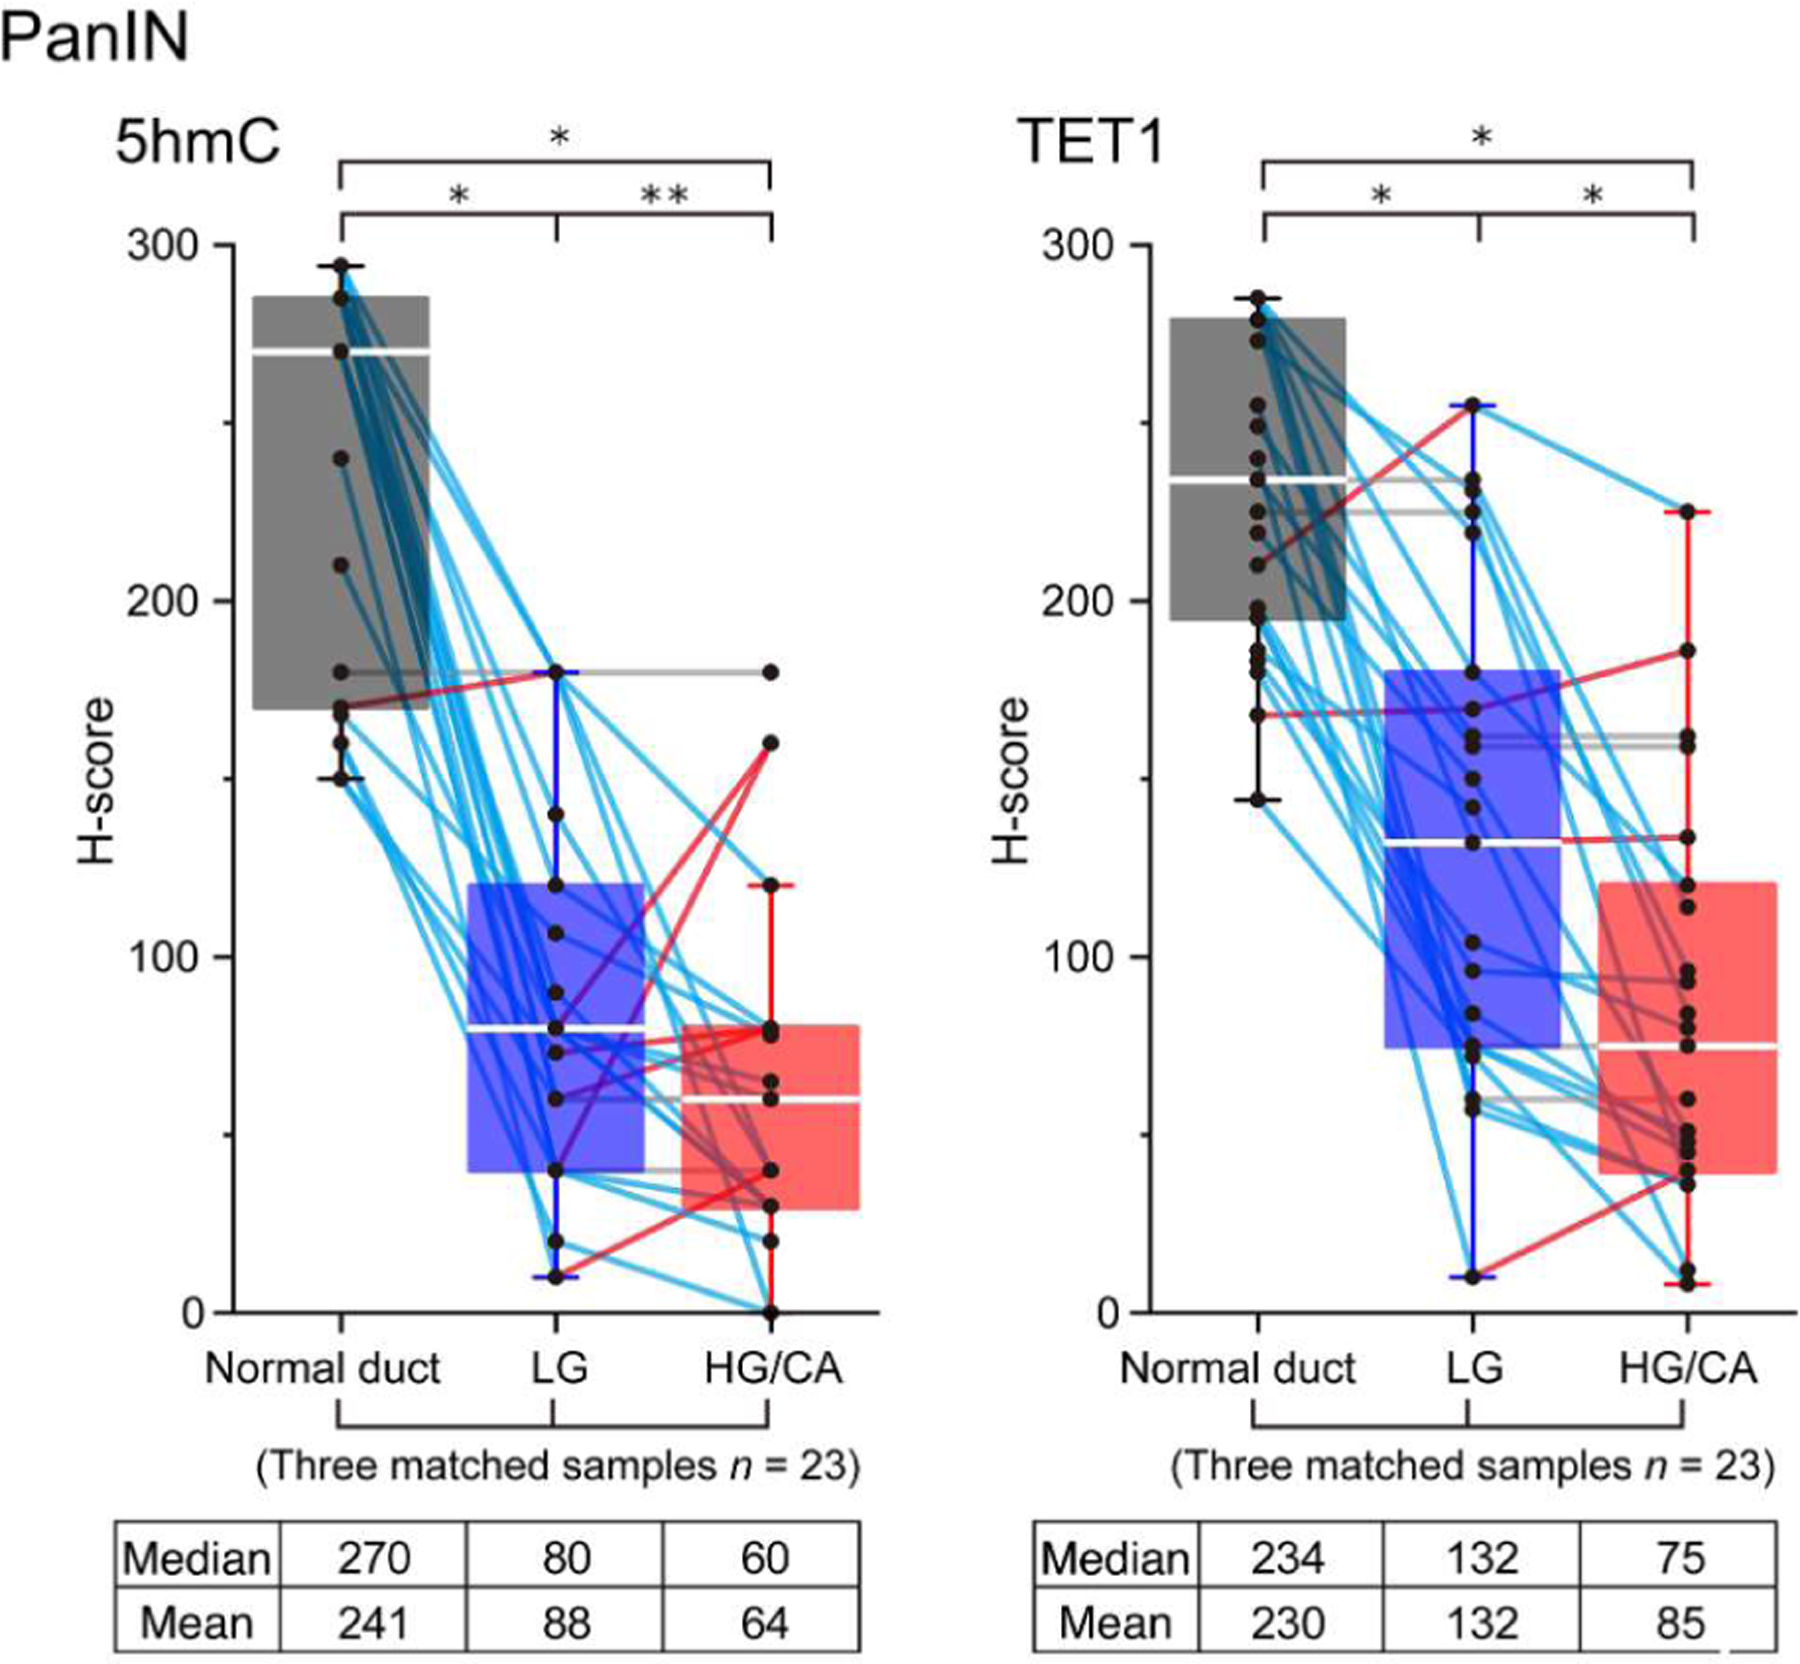
Figure 4.

Comparative analysis of H-scores in the matched samples from PanIN cases. Box-plot of H-scores of 5hmC and TET1 on PanIN slides (n = 23) with three matched samples (normal duct, low-grade lesion, and high-grade/carcinoma lesion) at the same time. Each score is represented by a small circle, and the matched data for each individual are joined by a solid line (upregulation in red; downregulation in blue; no change in gray). For all box-plots, the solid center line represents the median, the lower and upper bounds of the box represent the 25th and 75th percentiles, respectively, and the whiskers are Tukey whiskers. Two-sided Wilcoxon signed-rank test, *p < 0.001, **p = 0.04. HG, high grade; LG, low grade; CA, carcinoma.
