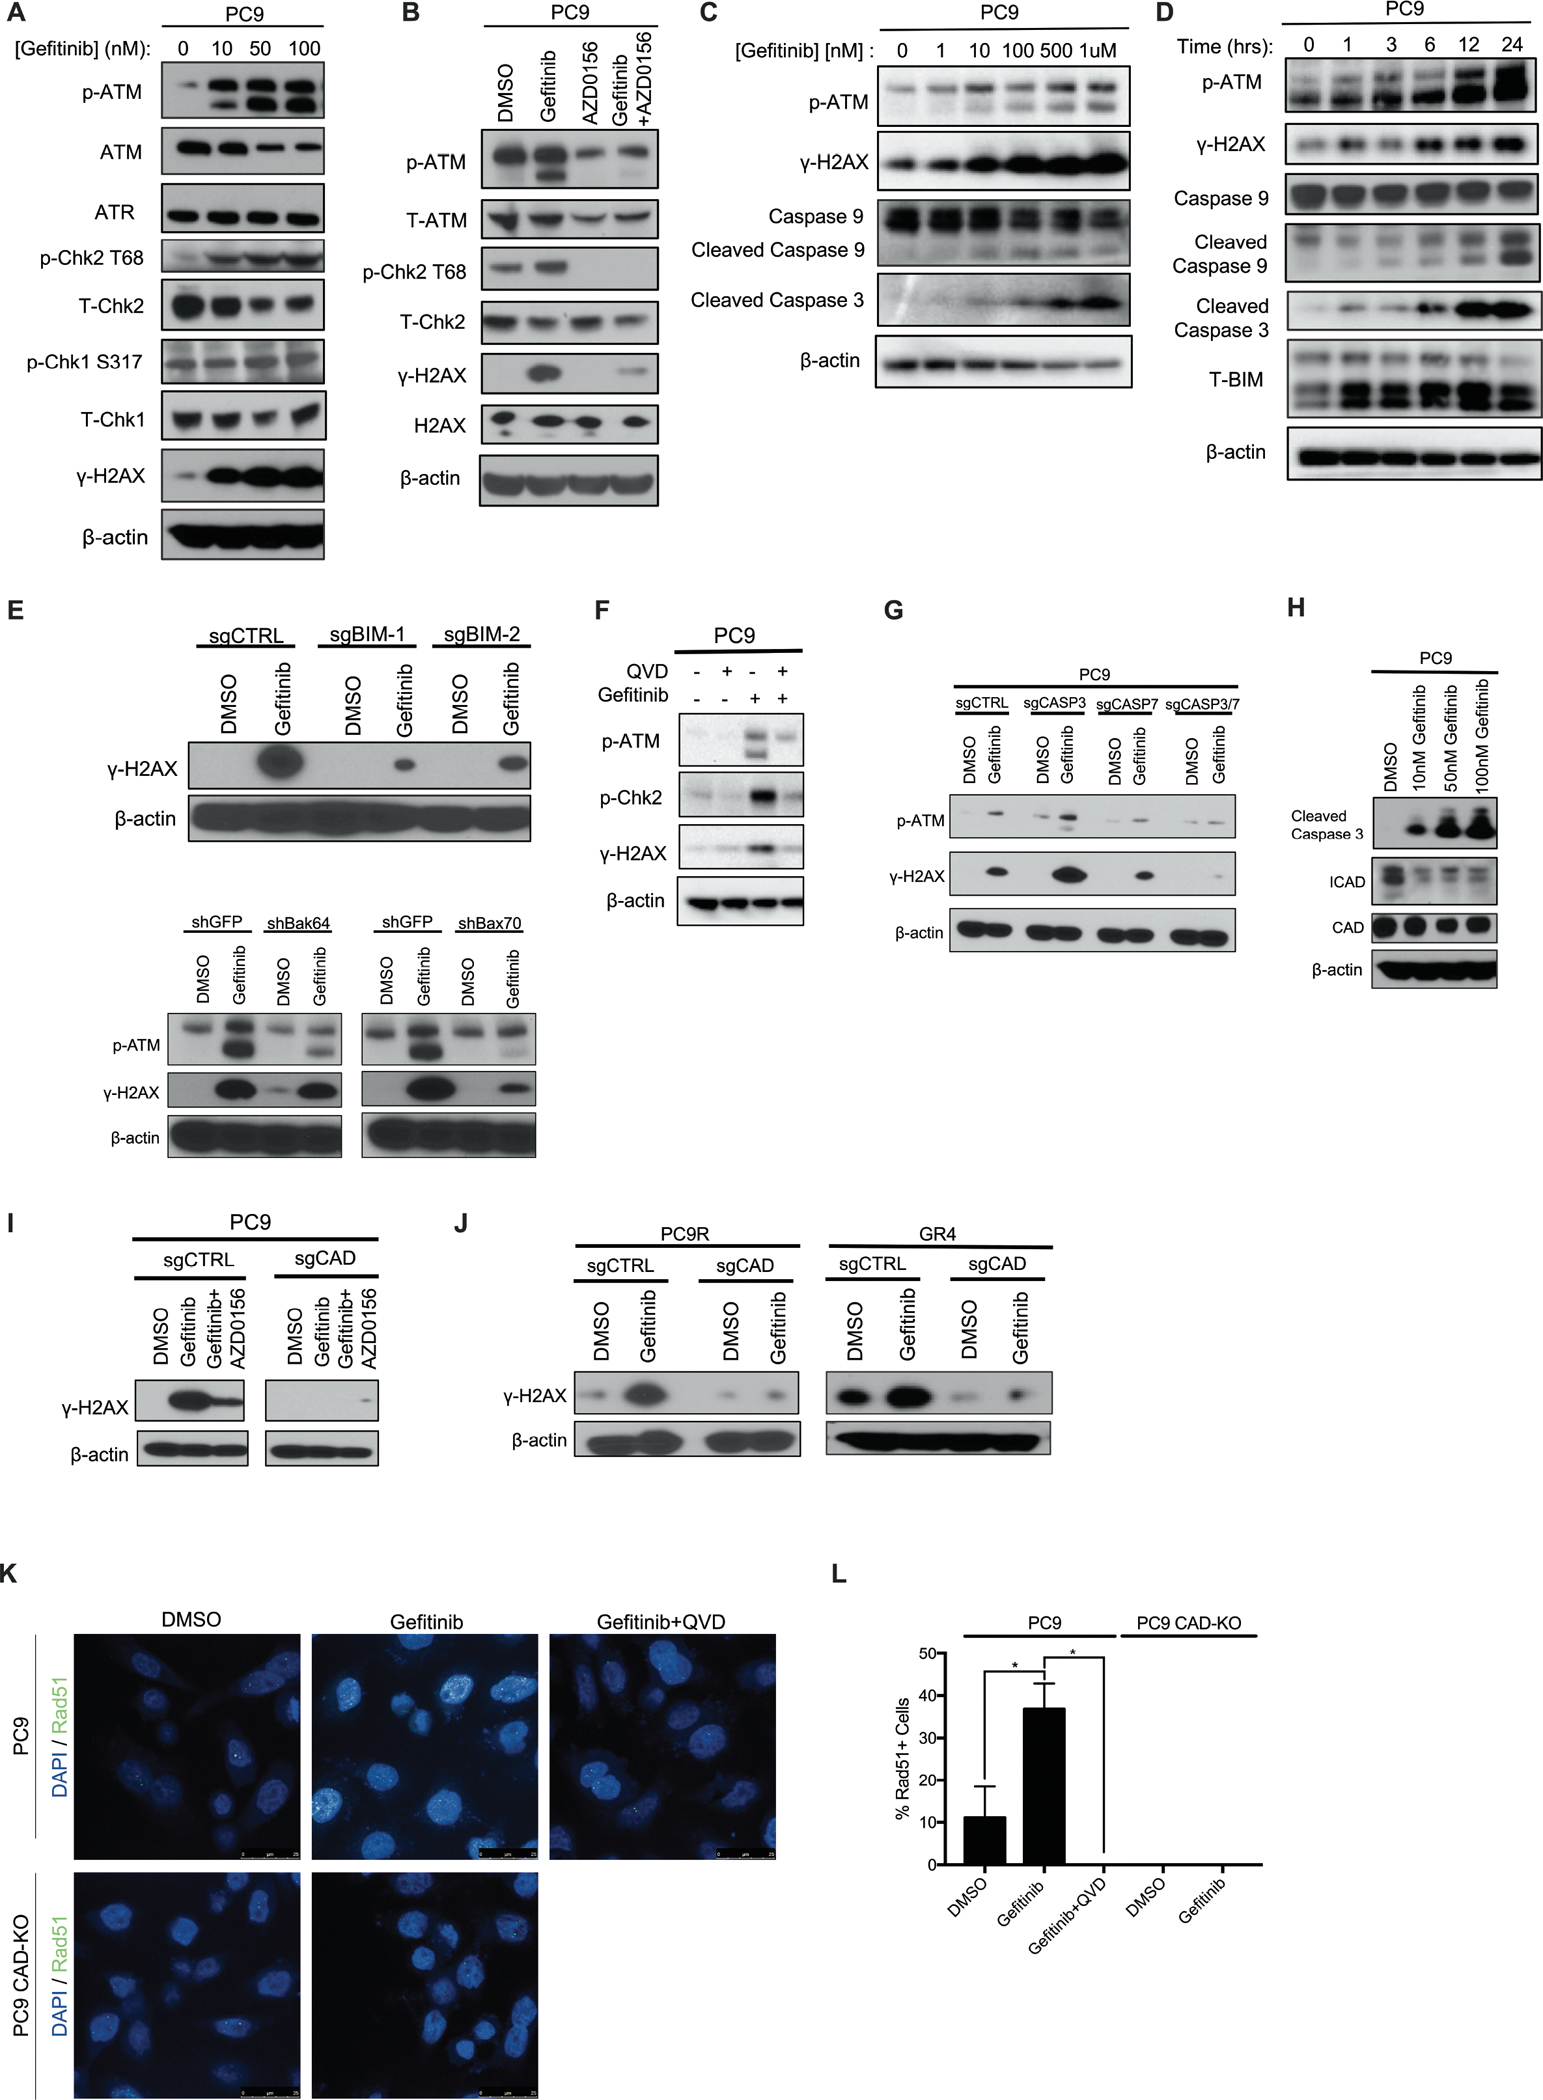
Figure 2: Characterization of EGFR inhibitor-induced ATM pathway activation.

A. Immunoblotting of various DNA damage response markers in PC9 cells following 24h treatment with gefitinib at the indicated doses. B. Immunoblot of PC9 cells following treatment with the EGFR inhibitor gefitinib (100 nM), AZD0156 (pharmacological inhibitor of ATM, 1.5 μM), or the combination of both EGFRi and ATMi for 24h. C. Immunoblot of PC9 cells treated with increasing concentrations of gefitinib for 24h. D. Immunoblot following treatment of PC9 cells with 100nM gefitinib for the indicated lengths of time. E. Immunoblot of 24h, 100 nM gefitinib-treated cells following CRISPR/Cas9-mediated knockout of BIM or RNAi-mediated short hairpin (shRNA) knockdown of BAK/BAX in PC9 cells. F. Immunoblot of PC9 cells treated with pan-caspase inhibitor Q-VD-OPh (2 μM), gefitinib (500 nM), or the combination for 24h. G. Immunoblot of PC9 cells following CRISPR/Cas9-mediated knockout of caspase 3, 7, or 3+7, post 24h, 100 nM gefitinib treatment. H. Immunoblot of 24h gefitinib-treated PC9 cells, revealing ICAD loss. I. Immunoblot of 24h, 100 nM gefitinib-treated cells following CRISPR/Cas9-mediated knockdown of CAD in PC9 cells. J. Immunoblot of 24h, 100 nM gefitinib-treated cells following CRISPR/Cas9-mediated knockout of CAD in EGFR inhibitor-resistant cells. K. Confocal microscopy images of Rad51 loading assay in PC9 cells following treatment with 100 nM gefitinib, Q-VD-OPh (2 μM) or the combination for 24h with and without the presence of CAD. L. Bar graph quantification of images in (K). N=3 for all groups presented, where the mean ± S.E.M is plotted. P values were determined using one-way ANOVA with Tukey’s post hoc test. * refers to P<0.05.
