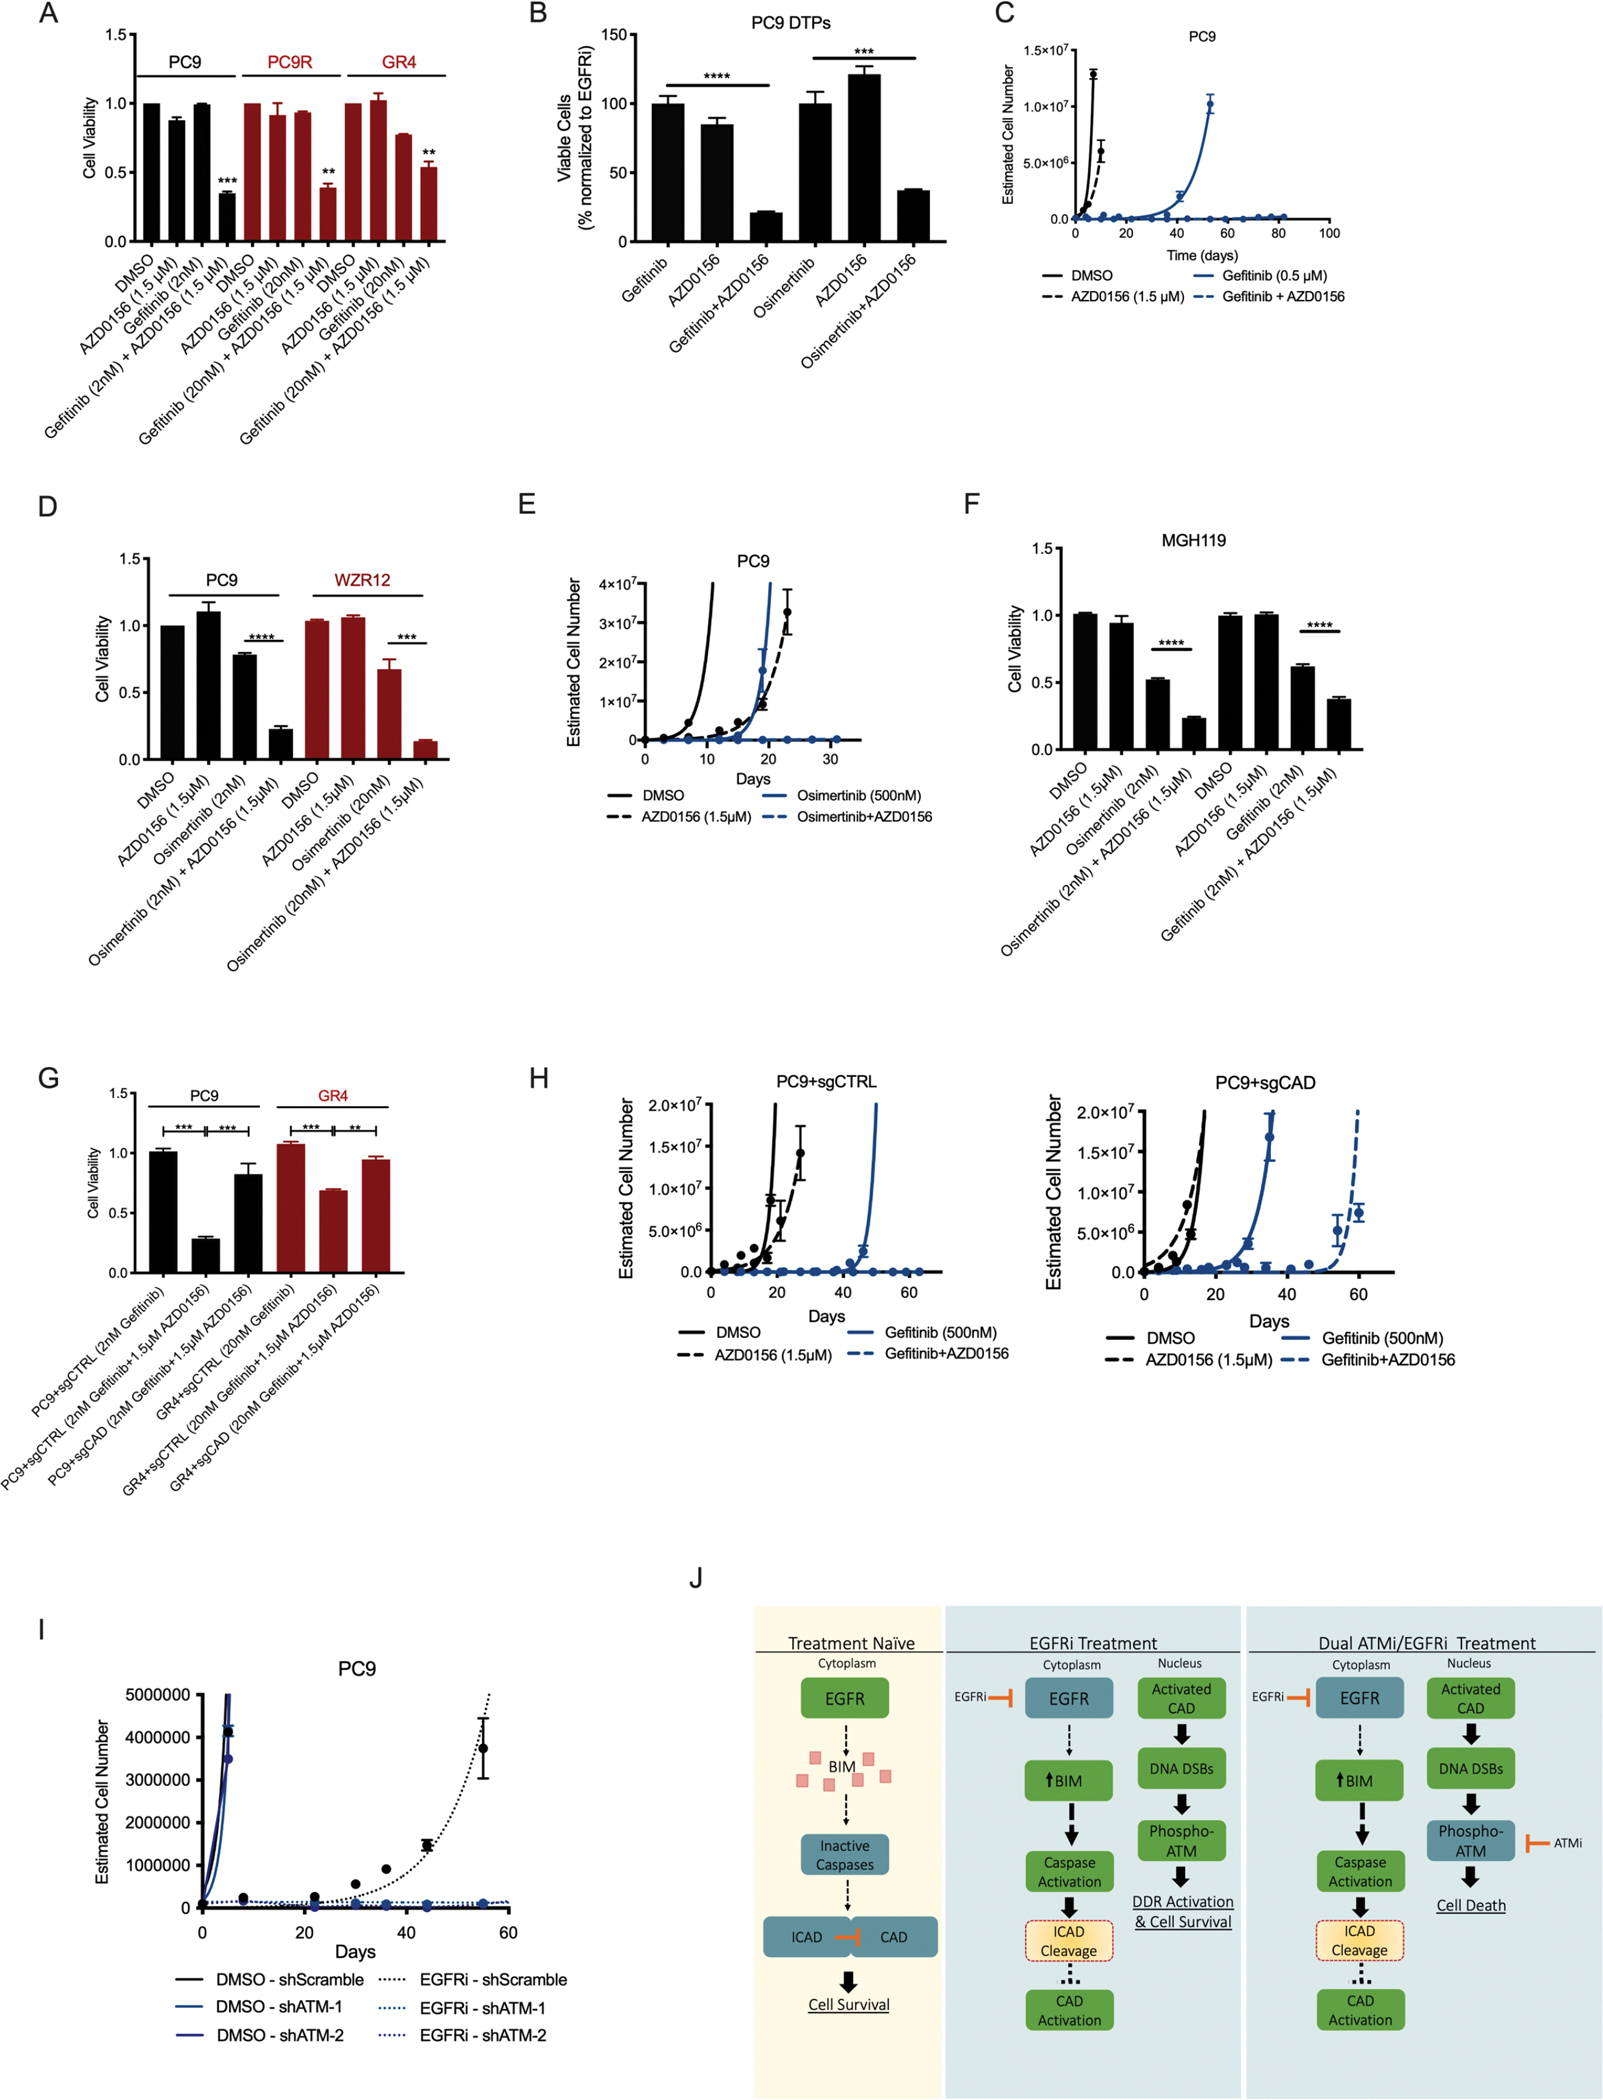
Figure 3: Effect of ATM inhibition on survival and growth of EGFR inhibitor-resistant cells.

A. Cell viability in the indicated drug treatment conditions in EGFR inhibitor-sensitive (PC9) and -resistant (PC9R, GR4) cells. B. Cell viability, as assessed through the percentage of surviving cells (normalized to gefitinib-only treated), of PC9 drug-tolerant persisters (DTPs) following 4-day treatment with single-agent gefitinib (100 nM), AZD0156 (1.5 μM), or combination. C. Estimated cell number during long-term time-to-progression (TTP) assay of PC9 cells treated with gefitinib, AZD0156 or the combination. D. Cell viability in the indicated drug-treatment conditions in EGFR inhibitor-sensitive (PC9) and -resistant (WZR12) cells. E. Estimated cell number during long-term time-to-progression (TTP) assay of PC9 cells treated with osimertinib, AZD0156, or the combination. F. Cell viability in the indicated drug treatment conditions in EGFR inhibitor-sensitive MGH119 cells. G. Cell viability in the indicated drug treatment conditions in EGFR inhibitor-sensitive (PC9) and -resistant (GR4) cells with or without CAD presence (sgCTRL or sgCAD, respectively). H. Estimated cell number during long-term time-to-progression (TTP) assay of PC9 cells treated with gefitinib, AZD0156, or the combination, with or without CAD presence (sgCTRL or sgCAD, respectively). I. Estimated cell number during long-term time-to-progression (TTP) assay of PC9 cells treated with vehicle or gefitinib, with or without ATM presence (shScramble or shATM, respectively). J. Conceptual diagram linking EGFR inhibition to ATM activation and dependence. N=3 for all cell viability assays and estimated cell number during long-term time-to-progression assays presented, where the mean ± S.E.M is plotted. P values were determined using unpaired, two-tailed Student’s t-tests. ** refers to P<0.01, *** refers to P<0.001, and **** refers to P<0.0001.
