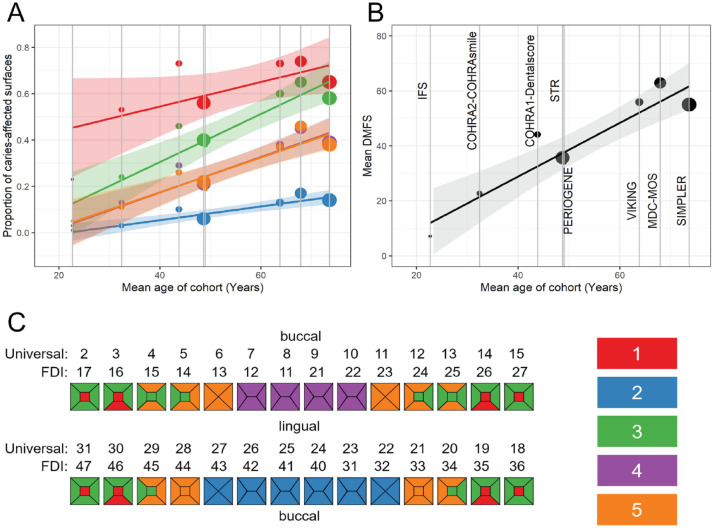
Figure 2.
Caries experience (defined as the mean proportion of caries-affected surfaces within each cluster) differs among the 5 caries clusters in Gene-Lifestyle Interactions in Dental Endpoints 2 (GLIDE2) with similar patterns across all GLIDE2 cohorts. Caries experience in these caries clusters increases with age in the GLIDE2 cohorts (A), mirroring the overall increase in decayed, missing, and filled surfaces (DMFS) with age. (B) The size of markers is scaled to the number of participants in the participating studies. Regression lines and standard errors are estimated from inverse standard error-weighted linear meta-regression models. Cluster membership is illustrated on the odontogram (C), and colors in the legend refer to the cluster numbers given in Table 2.

