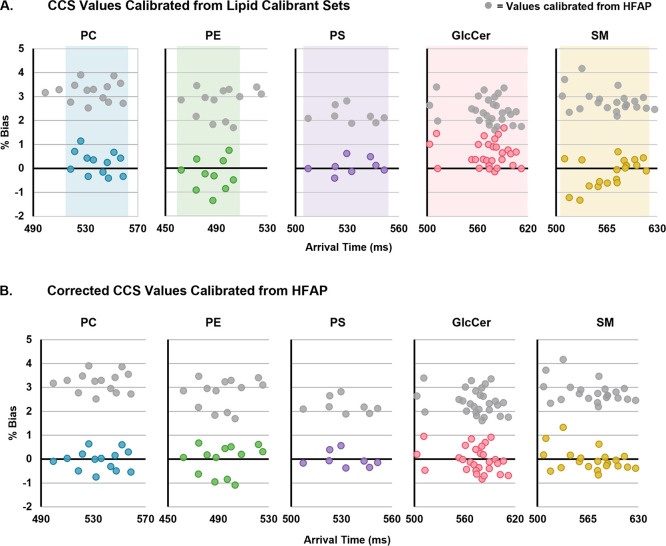
Figure 3.
CCS biases from triplicate DTCCS values of two types of calibration strategies. In both panels, gray values represent those calibrated using HFAP calibrants with no added correction factor. (A) Lipids calibrated from lipid calibrants within the same subclass. Shaded regions represent the arrival time ranges of the calibrant sets. Analyte lipids falling outside the calibrant range are excluded due to the high error associated with extrapolating polynomials. (B) Lipids calibrated from HFAP calibrants with an added subclass-specific correction factor.

