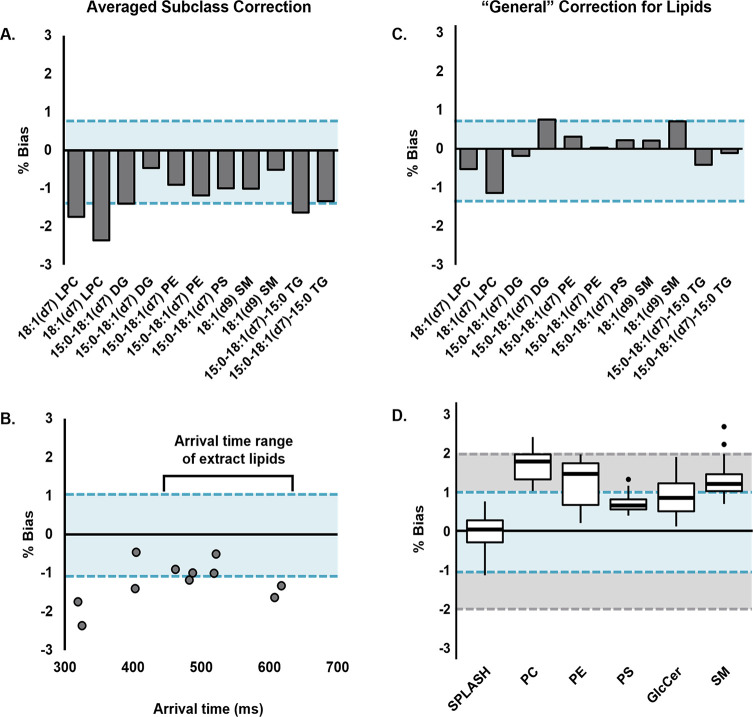
Figure 5.
CCS biases from DTCCS values of heavy-labeled lipid standard mix components. In all panels, blue shaded regions represent the target bias of ±1%. (A) Standard lipids calibrated with HFAP and an averaged correction factor derived from the five standard extracts examined in this study. Analytes are arranged in order of increasing measured arrival times. (B) Arrival time range of the standards as compared to those of the lipid extract species. (C) Standard biases when calibrated with HFAP and a “general” correction factor of 1.5%. (D) Biases of the standard mix (SPLASH) as well as lipid extract species when calibrated using the general correction factor. The gray shaded region represents the expected bias of conventional TWIMS, ± 2%.

