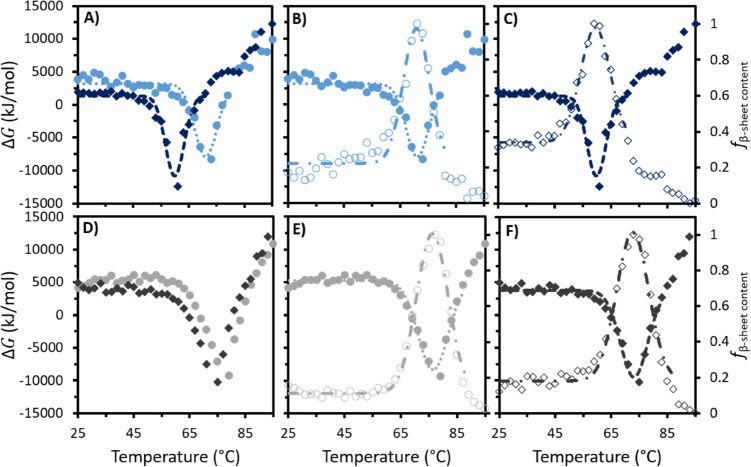
Figure 4.
For IgG4 in water, overlays of (A) ΔGf and ΔGs, (B) ΔGf and ffβ – sheet content, and (C) ΔGs and fsβ – sheet content. For IgG4 in 50 wt % [Cho]Cl, overlays of (D) ΔGf and ΔGs, (E) ΔGf and ffβ – sheet content, and (F) ΔGs and fsβ – sheet content. Circles and diamonds represent the behavior of freshly prepared and stored samples, respectively, with dotted and dashed lines showing the Gaussian curves fitted to the data sets and used to calculate ΔGmin. Solid symbols (left axis) and unfilled symbols (right axis) show ΔGmin and fβ – sheet content, respectively. For all samples, see Figure S2.

