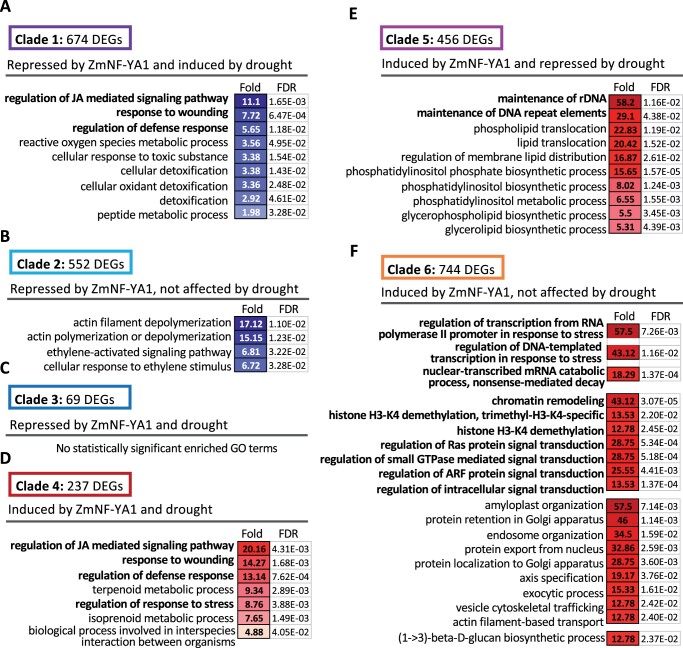
Figure 5.
Transcriptome analysis of the zmnf-ya1 mutant and WT under normal and drought stress. A–C, Significantly enriched GO terms of the Clades 1–3 DEGs repressed by ZmNF-YA1 identified in Supplemental Figure S10D. DEGs in Clades 1–3 were upregulated DEGs in the zmnf-ya1 mutant (i.e. repressed by ZmNF-YA1) and they could be further grouped into Clades 1–3 based on their response to drought stress. D–F, Significantly enriched GO terms of the Clades 4–6 DEGs induced by ZmNF-YA1 identified in Supplemental Figure S10E. DEGs in Clades 4–6 were downregulated DEGs in the zmnf-ya1 mutant (i.e. induced by ZmNF-YA1) and they could be further grouped into Clades 4–6 based on their response to drought stress. Values indicate the fold enriched and the FDR values for the corresponding GO terms. The color intensity indicates the enrichment degree. All the GO enrichment analysis results of the six clades DEGs identified in Supplemental Figures S10D and S10E were list in Supplemental Table S4.

