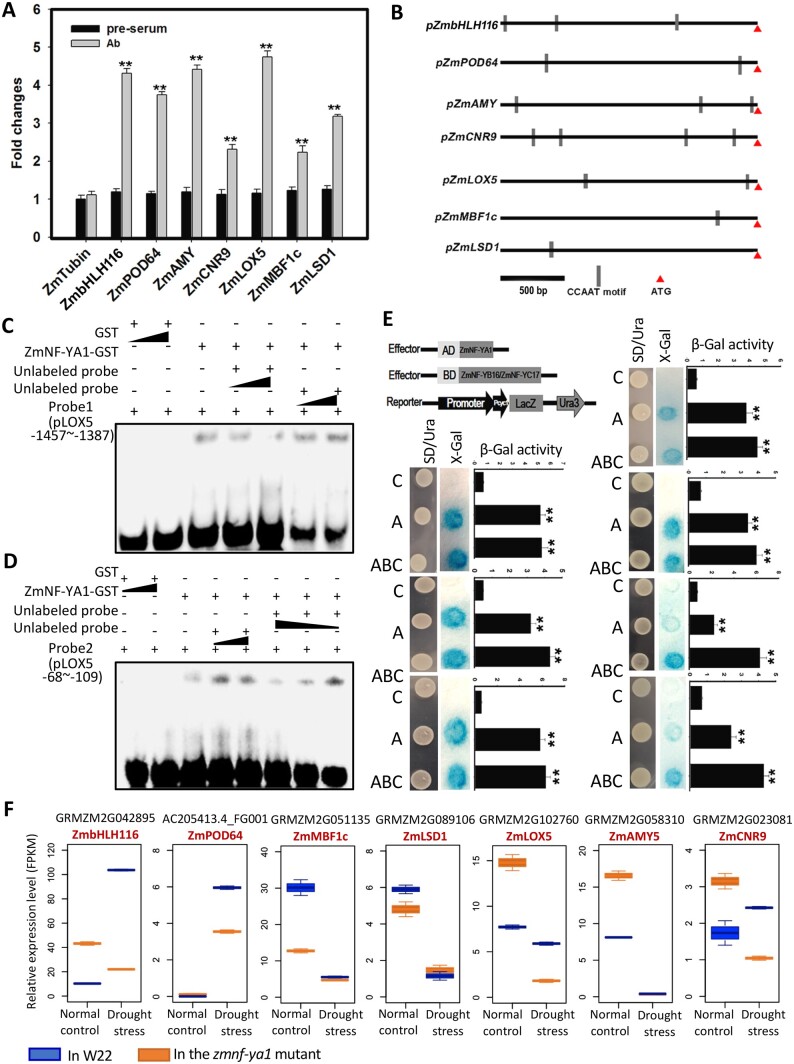
Figure 6.
Validation of candidate downstream genes. A Chip-qPCR analysis of the seven candidate downstream genes. B, Distribution of the CCAAT motif on the promoters of candidate downstream genes. C, EMSA showing that ZmNF-YA1 binds to the CCAAT motif at −1,457∼−1,387 bp of the ZmLOX5 promoter. D, EMSA showing that ZmNF-YA1 binds to the CCAAT motif at −68∼−109 bp of the ZmLOX5 promoter. E, Yeast one-hybrid analysis of seven candidate downstream genes. C, Control; A, co-transformed with ZmNF-YA1; ABC, co-transformed with ZmNF-YA1, ZmNF-YB16 and ZmNF-YC17. F, Relative expression level boxplot of the seven candidate downstream genes. The blue boxes indicate the expression levels in W22 and the orange boxes indicate the value from the zmnf-ya1. In each box, different lines represent the minimum, maximum, median, first quartile, and three quartiles of the dataset.

