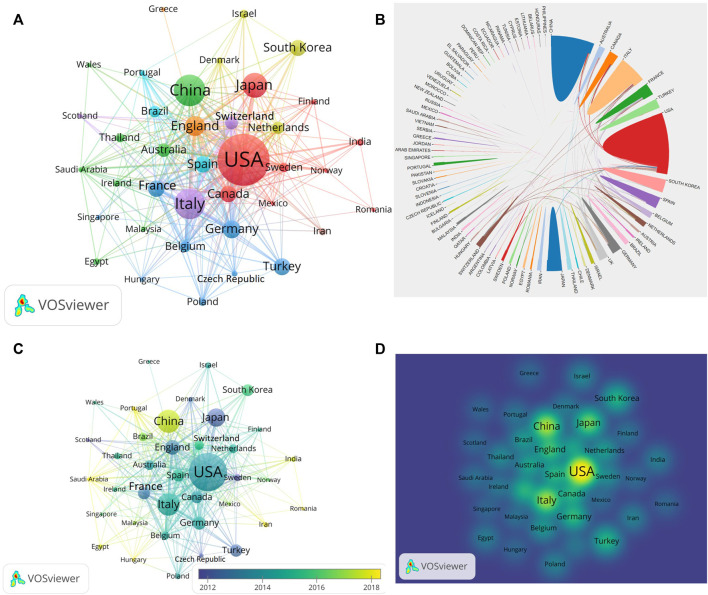
FIGURE 3.
Visualization map of countries involved in HA for the treatment of OA research. (A) Collaboration between coutries based on VOSviewer. (B) Collaboration between coutries based on Online Analysis Platform of Literature Metrology. (C) Dynamics and trends of coutries over time. (D) Density map of country distribution of published articles based on VOSviewer.

