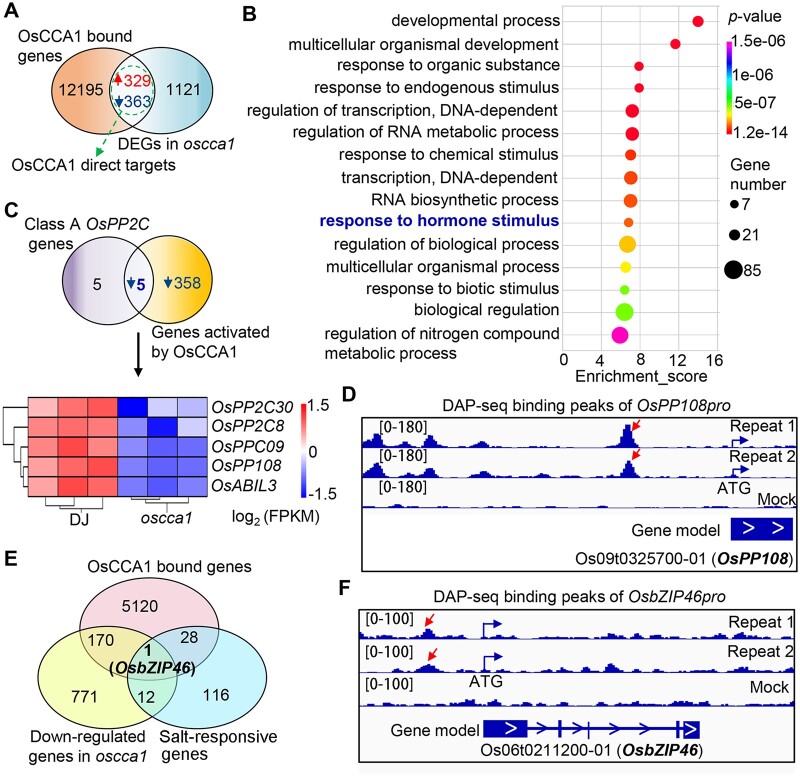
Figure 5.
OsCCA1 directly regulates genes involved in ABA signaling. A, Venn diagram showing a comparison of DAP-seq binding genes with the identified DEGs in oscca1 mutant by RNA-seq. The overlapped genes were considered as OsCCA1 direct targets. B, The top 15 enriched GO terms of the OsCCA1 direct targets showed in (A). P-value was defined by Fisher’s test. C, Venn diagram depicting the overlapped gene number between OsCCA1 activated direct target genes and class A PP2C members. The heatmap showing the transcriptional abundances of five overlapped genes in oscca1 mutants and DJ plants. The scale bar showing the log2 (FPKM). D, The binding peaks (repeats 1 and 2) and negative control (mock) of OsCCA1 in OsPP108p (−2,625 bp) by DAP-seq. The [0–180] shows the scale bar of binding peak that refers to the height of the peak. E, Venn diagram showing OsbZIP46 is the only gene among OsCCA1-bound genes, downregulated genes in oscca1 mutant, and the known salt-responsive genes. F, The binding peaks (repeats 1 and 2) and negative control (mock) of OsCCA1 in the promoter (−1,263 bp) of OsbZIP46 by DAP-seq. The [0–100] shows the scale bar of binding peak that refers to the height of the peak.

