Figure 3.
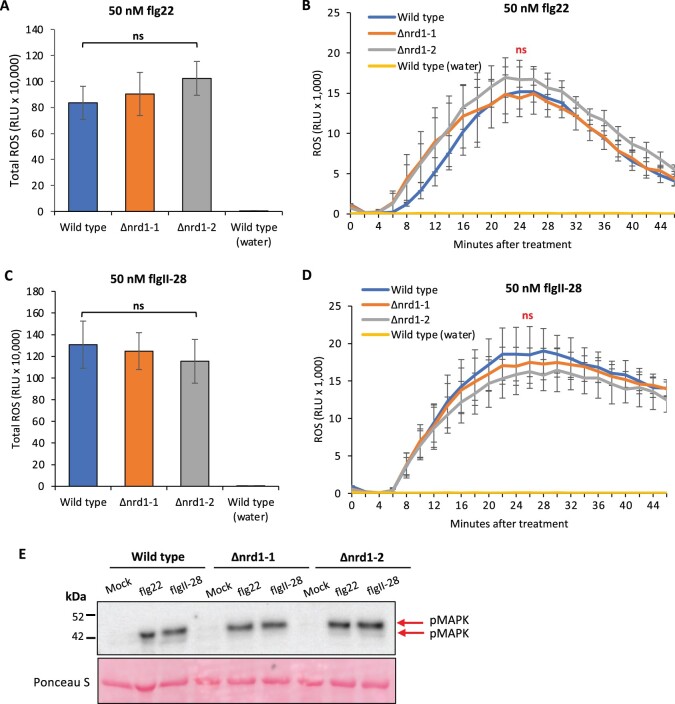
Investigation of MAMP-induced ROS production and MAPK activation in the Δnrd1 mutants. A–D, Leaf discs from Δnrd1 or RG-PtoR wild-type plants were treated with 50-nM flg22 (A and B), 50-nM flgII-28 (C and D), or water only. Relative light units (RLU) were measured over 45 min. One-way ANOVA followed by Student’s t test (P < 0.05) was performed for total ROS (A and C) or at 24 min (peak readout) and 45 min after treatment with flg22 or flgII-28 (B and D). Bars represent means ± sd in (A, B, C, and D). No significant difference was observed between Δnrd1 and wild-type plants with either treatment. E, Leaf discs from wild-type RG-PtoR plants and Δnrd1 mutants were treated with 10-nM flg22, 25-nM flgII-28, or water (mock) for 10 min. Proteins were extracted from a pool of discs from plants of the three genotypes and subjected to immunoblotting using an anti-pMAPK antibody that detects phosphorylated MAPKs (red arrows). Ponceau staining shows equal loading of proteins.

