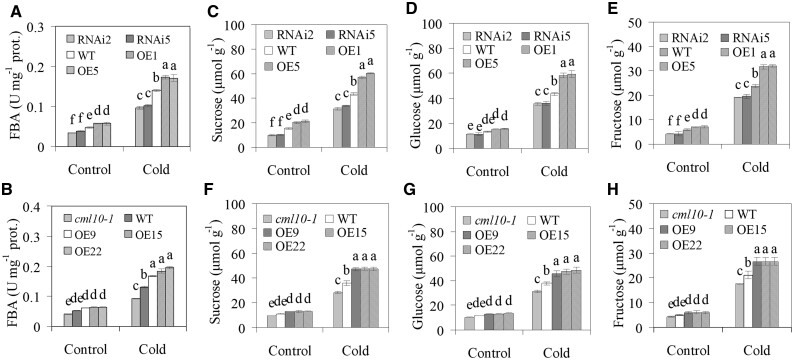
Figure 8.
Analysis of FBA activity and sugar concentrations in response to cold. FBA activity in MsCML10-RNAi and MsCML10-overexpressing alfalfa (A) as well as in MsCML10-overexpressing M. truncatula and cml10-1 (B) in comparison with the WT were measured after 7 days of cold treatment at 4°C. Sucrose (C and F), glucose (D and G), and fructose (E and H) in MsCML10-RNAi and MsCML10-overexpressing alfalfa (C, D, and E) as well as in MsCML10-overexpressing M. truncatula and cml10-1 (F, G, and H) were measured after 7 days of cold treatment at 4°C. Means of three replicates and standard errors are presented; the same letter above the column indicates no significant difference at P < 0.05 using Duncan’s test.

