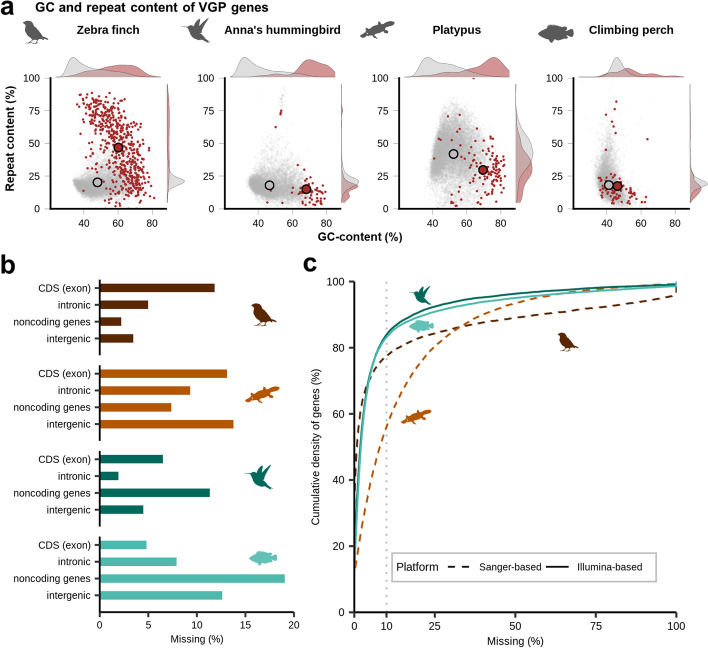
Fig. 3.
Amount and characteristics of missing genes and exons. a GC and repeat content of completely missing genes in previous assemblies (red) but present in the VGP assemblies compared to those of genes present (gray) within both previous VGP assemblies. b Percent missing of exonic, intronic, non-coding genic, and intergenic sequences in the prior assemblies. c Cumulative density plot of protein-coding genes as a function of percent missing sequence. Illumina-based assemblies (Anna’s hummingbird and climbing perch) have more complete genes compared to Sanger-based assemblies (zebra finch and platypus). Gray dashed line indicates where 10% of a gene is missing

