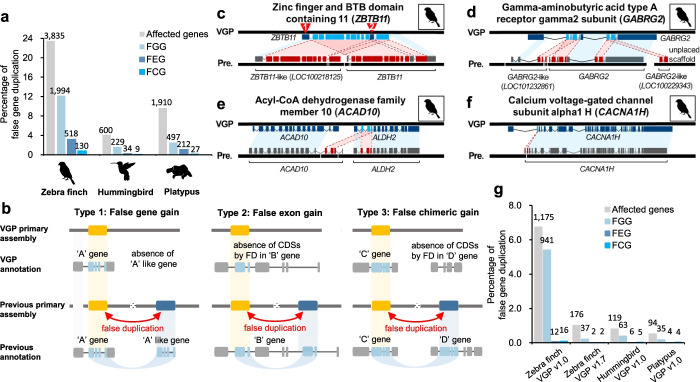
Fig. 4.
Mis-annotations due to false duplications. a Amount and percentage of all genes with mis-annotations caused by false duplications in the previous assemblies. The amount of genes of each type is shown on the top of each bar graph. b Types of mis-annotations caused by false duplications. When >50% of the CDS length of a gene was falsely duplicated and annotated as another gene, and resulted in two genes with similar function (e.g., -like), we classified it to false gene gain (FGG, Type 1). When an exon within a gene was falsely duplicated, we classified it to false exon gain (FEG, Type 2). If the duplicated exon was falsely inserted to another existing gene of different function, we classified it as a false chimeric gain (FCG, Type 3). c FGG of ZBTB11. d FGG of GABRG2. e FCG involving ACAD10 and ALDH2. f FEG within CACNA1H. The red lines represent the connection between false duplications and the homologs in the VGP assembly. The blue boxes represent the homologous region between the VGP and previous assemblies. The white spaces in the black bars represent scaffold assembly gaps. g Amount of false gene annotation in VGP assemblies. The zebra finch VGP v1.0 assembly had false duplications purged with purge_haplotigs after scaffolding; the zebra finch VGP v1.7 had false duplications purged with purge_dups before scaffolding

