Abstract
Nanoclusters (NCs) are considered as initial states of condensed matter, and unveiling their formation mechanism is of great importance for directional synthesis of nanomaterials. Here, we initiate the reaction of Ag(i) ions under weak reducing conditions. The prolonged reaction period provides a unique opportunity for revealing the five stages of the growth mechanism of 20-electron superatomic Ag70 NCs by a time-dependent mass technique, that is, aggregate (I) → reduction (II) → decomposition and recombination (III) → fusion (IV) → surface recombination and motif enrichment (V), which is different from the formation process applicable to the gold clusters. More importantly, the key intermediates, Ag14 without free electrons (0e) in the first (stage I) and Ag24 (4e) in the second (stage II), were crystallized and structurally resolved, and the later transformation rate towards Ag70 was further controlled by modulating solvents for easy identification of more intermediates. In a word, we establish a reasonable path of gradual expansion in size and electrons from Ag(i) ions to medium-sized 20e Ag70. This work provides new insights into the formation and evolution of silver NCs, and unveils the corresponding optical properties along with the process.
The bottom-up synthesis of “medium-sized” Ag70 (20e) was controlled and tracked, and then revealed. The crystallized key intermediates of Ag14 (0e) and Ag24 (4e) present the growth snapshots of silver nanoclusters.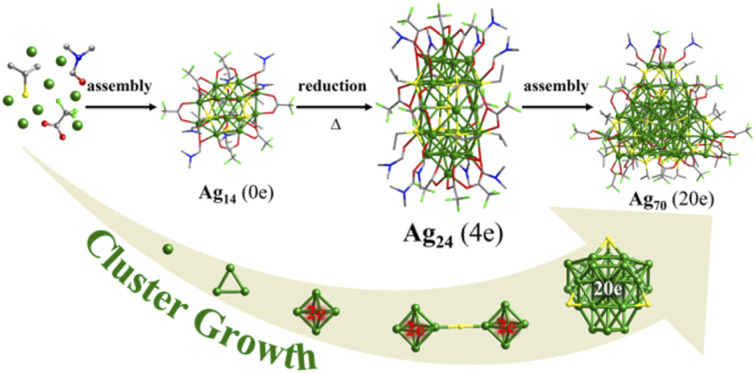
Introduction
Atomically precise coinage metal (M = Au,1 Ag,2 Cu3) nanoclusters as the bridges between atoms and nanoparticles,4 which provide a unique opportunity for gaining fundamental knowledge of nanoparticles, are a newly emerging hot topic in nanoscience. Their diverse aesthetic structures with discrete energy levels and extensive modification greatly promote their increasing attraction in the fields of chirality,5 luminescence,6 catalysis,7 sensing,8 and biomedicine.9 Clear identification of the grand evolution of structures and properties from discrete atoms to the metallic state, and the effectively controlled synthesis of intermediates of large-sized metal NCs remain tough tasks.10 Xie and co-workers investigated the formation mechanism and evolution process of atomically precise thiolate-stabilized Au and Ag NCs from simple metal-thiolate precursors by real-time electrospray ionization-mass spectrometry (ESI-MS).11 For gold NCs, the step-by-step formation process from Au(i)–SR monomers to oligomers to NCs has been revealed by using well-known model Au25.11e,f Wang developed a facile approach to assemble different thiolate-stabilized Au25 with eight valence electrons (8e) in high yield (∼100%) on a large scale, starting from a preformed Au13 (8e) crystalline material, showing that the formation of metal NCs can be achieved by forming stable metal cores and then enriching Au(i)–SR staples on the surface.12 Generally, the most commonly used method for the preparation of “medium/large-sized” metal NCs (nucleus number more than 50) is the reduction of metal precursors with appropriate reducing agents (such as NaBH4, Ph2SiH2, and the borane tertbutylamine complex).13 The reduction process (M(I) → M(0)) is basically completed within a few minutes and this quick reduction process makes it difficult to capture the intermediates in the single crystal form.11d–g
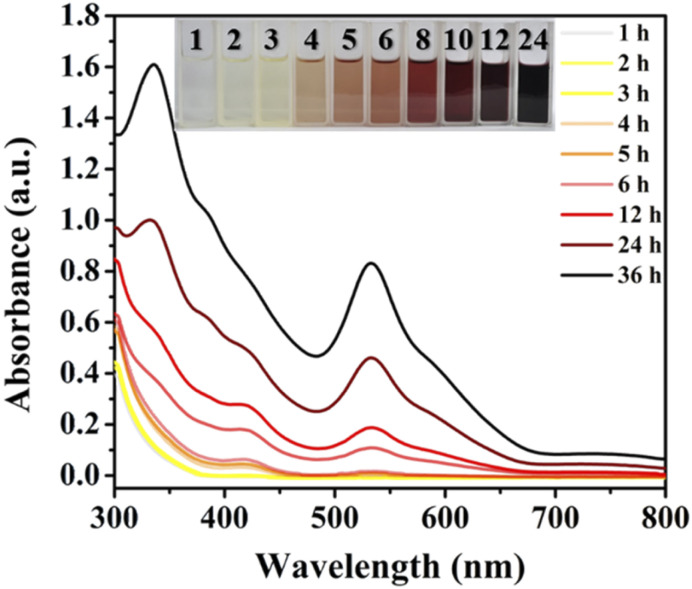
The structure and size of silver NCs are considered to be mainly related to the number of silver atoms in the intermediate products.11g So far, the detailed process from silver ions to NCs, including the reduction and nucleation process for metal NCs is still a black box. Recently, we reported a 20e Ag70 nanocluster, ([NH2(CH3)2][Ag70S4(SiPr)24(CF3COO)20]),14 using DMF as a reductant. The slow reduction process to Ag70 in ten hours (Fig. 1) provides a platform to follow the growth process, capture intermediates and reveal the formation mechanism of the “medium-sized” silver NCs.
Fig. 1. Time-dependent UV-vis absorption spectra for tracking the reaction process. Experimental method: 9 mg {Ag(SiPr)}n, 22 mg CF3COOAg, and 50 μL CF3COOH in the solvent mixture (iPrOH : DMF = 3 : 1) at 80 °C. Inset: the colour of mother liquor after the solvothermal reaction at different times (1–24 h).
In this work, we carefully studied the formation of Ag70 (ref. 14) by time-dependent UV-vis spectroscopy and ESI-MS. By controlling the synthesis conditions, we successfully crystallized the key species Ag24S(SiPr)8(CF3COO)10(DMF)10 (denoted as Ag24) with four valence electrons (4e). Ag24 has two relatively independent delocalized centers Ag64+, separated by an anion-template S2−. Time-dependent ESI-MS and the mass difference fingerprint of isomorphism (MDFI) method unveil the transformation process from Ag(i) ions, 4e Ag24 to 20e Ag70. Careful analysis based on the experimental data shows that Ag70 is not directly formed via DMF reduction from Ag(i) ions or pre-generated Ag(i)–S aggregates with a similar size, but generated through a cascade of reactions of the intermediates, including aggregation, reduction, decomposition, recombination, fusion, surface recombination and motif enrichment. The formation mechanism of the medium-sized silver NCs is instructive and meaningful in revealing the essence of the original state of metal nanoparticles.
Results and discussion
Tracking the growth process of Ag70
Identification of the intermediate species by the high-resolution ESI-MS technique during the reduction process is a straightforward and effective method to elucidate the growth mechanism of metallic NCs, which has been achieved in the synthesis of classic gold clusters.11a–f,12 However, the complexity of the reaction system and the mutable inherence of silver intermediate species hinder the in-depth study of Ag NCs. Little progress based on the structural evolution and size expansion of Ag0-containing homosilver NCs is reported.11g Recently, it was found that the reaction solution of the superatomic Ag NC (Ag70) reported by our group has obvious color changes (from yellow to red (black), Fig. 1) at different times, and there may be intermediate products which are beneficial to explore the growth process of Ag70.
A series of improved experiments were carried out to achieve our goal (Fig. S1–S5, see details in the ESI†). Using different reaction times or conditions to control the reduction process, the color of the mother liquor is significantly different (Fig. 1), which indicates that the reduction degree of the system gradually deepened. The thiol (HSR) and carboxylic acid (R′COOH) ligands used in the system were finely adjusted (R: –CH(CH3)2 → –CH(CH3)(CH2CH3); R′: –CF3 → –CF2CF3) and a similar phenomenon emerged in an attempt to characterize the generality of the process and identify some intermediates by the MDFI method (Fig. S6†). The solution components of the above-mentioned reaction were monitored by ESI-MS.
Determination of intermediates by the mass difference fingerprint of isomorphism (MDFI) method
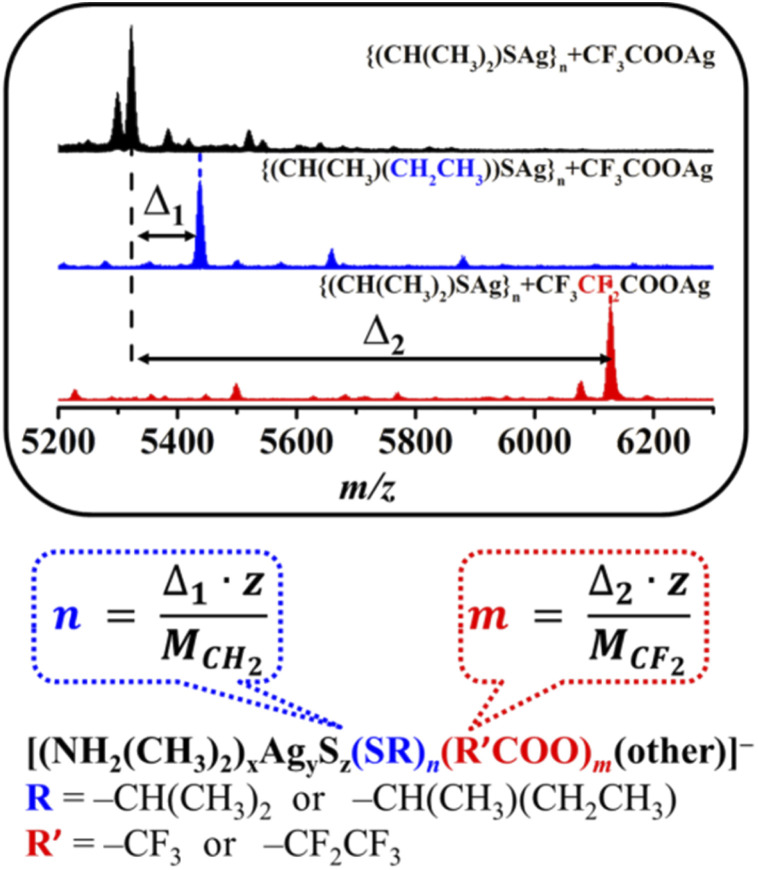
Identifying meaningful unknown species with large masses (m/z > 2000) based on the ESI-MS data is a great challenge. By unrestrictedly matching m/z values, a lot of irreducible results can be obtained within the range of the allowable error. Of course, common methods (isotope (H/D) labeling) of determining H− in H-rich metal NCs can be used, but at an unquestionably high cost. Inspired by a study on the hydrolysis process of lanthanide (Ln3+) clusters, to accurately determine the amount of a component of the species corresponding to the peaks from the ESI-MS data, an MDFI method that utilizes a certain mass difference of similar ligands to determine the exact number of the corresponding components in different species is proposed.15 This method is based on the fact that similar experimental phenomena can still be observed when the relevant ligands (R: –CH(CH3)2 → –CH(CH3)(CH2CH3) or R′: –CF3 → –CF2CF3) are changed in the reaction system (Fig. S6†). This result has inspired an encouraging speculation that they may have the same/similar growth process from an Ag+ ion to the target NC and intermediates during their formation. This MDFI method plays an important role in the subsequent identification of key intermediates (Scheme 1). For example, as shown in Scheme 1, a peak observed in the ESI-MS spectrum of the {iPrSAg}n + CF3COOAg system includes niPrS− and m CF3COO− ligands, and the analogue including n CH(CH3)(CH2CH3)S− or m C2F5COO− may be observed in the ESI-MS spectrum for {CH(CH3)(CH2CH3)SAg}n + CF3COOAg or {iPrSAg}n + C2F5COOAg systems (Fig. 3 and S7, S8†), where only one variable was changed (Scheme 1). Thus, based on the mass difference (Δ1 and Δ2) and charges (z), the number (n and m) of related ligands (iPrS− and CF3COO−) can be easily determined by using the related equation in Scheme 1. Note that this MDFI method is only used to rule out irreducible results. However, due to the presence of different ligands, it is normal that the peaks of related clusters do not conform to this phenomenon. For example, no peaks corresponding to the final product ([Ag70S4(SCH(CH3)(CH2CH3))24(CF3COO)20]2−) were found (Fig. S6a†).
Scheme 1. Determination of key intermediates by the mass difference fingerprint of isomorphism (MDFI) method. z is the charge.
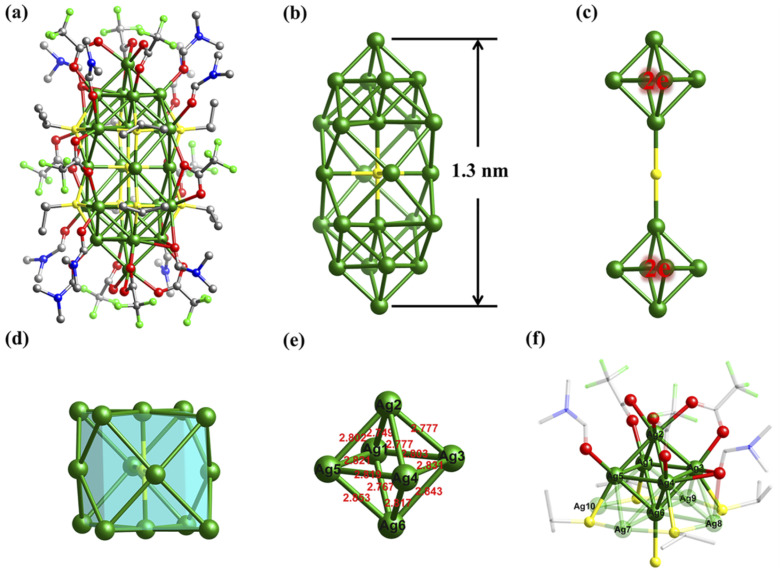
Fig. 3. The crystal structure of Ag24. (a) Ball-and-stick representation of the overall structure. (b) The ‘shuttle’-like 24-Ag-atom skeleton. (c) Two Ag64+ octahedra separated by S2−. (d) The cubic body S@Ag14 in the middle of Ag24. (e) Structural details and (f) coordination environments of Ag64+. Atom color codes: green, Ag; yellow, S; red, O; bright green, F; blue, N; grey, C. All hydrogen atoms are omitted for clarity.
Species assignment in solution
The time-dependent UV-vis spectra (Fig. 1) showed that the characteristic peak (ca. 530 nm) of Ag70 appeared after 4 h (Fig. S1†), corresponding to the color change of the mother liquor from yellow to orange. Interestingly, when the mother liquor changed to yellow (reaction time: 2–3 h), only a sharp characteristic absorption peak (416 nm) did not belong to Ag70 (Fig. S1d†), suggesting that intermediate substances may have been formed during the formation of Ag70.
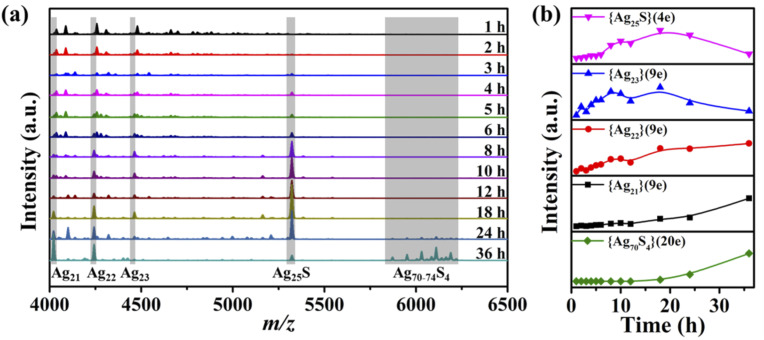
Time-dependent ESI-MS (Fig. 2 and S7, S8†) is used to confirm the presence of possible intermediates. Due to the complexity of the spectra and the presence of a large number of peaks, we focused on those peaks that appeared and intensified as the reaction proceeded. According to the real-time ESI-MS spectra, small AgIn clusters protected by organic ligands (SiPr− and CF3COO−), such as [NH2(CH3)2]x[Ag12+y(SiPr)6(CF3COO)7+x+y]− (x = 0–4, y = 0–3), existed in the reaction solution from the beginning to the end (Fig. S7–S9†). After 12 h, clear peaks corresponding to Ag70 (Fig. S7†) began to appear at m/z = 5800–6300 assignable to [NH2(CH3)2]x[Ag70S4(SiPr)24(CF3COO)20+x]2− (x = 0–4), which was consistent with the UV-vis results. Furthermore, the partial remaining peaks differ by a fixed value, 220 (assigned to CF3COOAg) and 159 (assigned to [NH2(CH3)2CF3COO]), which also fully indicates that these small molecules are easily enriched on the surface of clusters in the mother liquor. An obvious peak of m/z = 5322.82 attracted our attention, and its intensity gradually increased with the reaction time (2–12 h, Fig. 2b). Then it gradually decreased with the increase of Ag70 until it disappeared. This species is likely to be the intermediate/transition state that we are looking for. By employing the MDFI method, the number of SR− and R′COO− in this peak could be easily determined, and finally assigned to [NH2(CH3)2]4[Ag25S(SR)8(R′COO)16]− (denoted as {Ag25S}, R = –CH(CH3)2 or –CH(CH3)(CH2CH3); R′ = –CF3 or –CF2CF3; Fig. S6†). From the composition of the {Ag25S} cluster, it was found that it has four free valence electrons and one S2−, which may be the product of the reduction of monovalent Ag–S aggregates.
Fig. 2. Time-dependent ESI-MS spectra for the reaction solutions. (a) Negative ion mode ESI-MS data in the m/z range of 4000–6500 for the reaction solutions of 9 mg {Ag(SiPr)}n, 22 mg CF3COOAg, and 50 μL CF3COOH in the solvent mixture (iPrOH : DMF = 3 : 1) at 80 °C. (b) Intensity-based curves of {Ag25S}, {Ag23}, {Ag22}, {Ag21}, and {Ag70S4}. {Ag70S4} = [Ag70S4(SiPr)24(CF3COO)20]2−.
In addition to this {Ag25S} (4e) species, another group of species with 9 free electrons, {[NH2(CH3)2]3[Ag21+x(SiPr)5(CF3COO)11+x]}− (x = 0–2, denoted as {Ag21}, {Ag22}, and {Ag23}), was observed. As observed in the intensity curve based on the ESI-MS data in Fig. 2b, {Ag25S} species was the dominant product. It appeared after three hours of reaction and continued to increase as the reaction proceeded until it began to decrease after 18 hours. The {Ag23} species exhibited a similar trend in the concentration curve, which means that it may have been transformed from {Ag25S} species, and the increase in the number of free electrons is also reasonable. The intensities of {Ag21}, {Ag22}, and {Ag70S4} species have increased since their appearance, and especially the curves of {Ag21}, and {Ag70S4} have the same trend (Fig. 2b). A similar phenomenon (Fig. S8†) was also observed during the reaction of increasing {Ag(SiPr)}n. So, the evolution of {Ag70S4} may follow such a path: {Ag12–15} (0e) → {Ag25S} (4e) → {Ag21–23} (9e) → {Ag70S4} (20e), and the related detailed discussion is in the following part. Unfortunately, there is not much information available in positive ion mode ESI-MS to deepen our understanding of this process.
Structural characterization
Based on ESI-MS analysis, considering the abundance increase of {Ag25S} and other species in the early stage of the reaction, crystallization is quite helpful to determine their structures. Four kinds of crystals were obtained by evaporating the mother liquor at different reaction times at room temperature (Fig. S10†): colorless block (Ag14, 0 h), yellow block (Ag24, 3–6 h), black octahedral (Ag70·Ag12, 8–24 h), and black rectangular (Ag70, 36 h) crystals. If CF3COOAg and CF3COOH in the reaction are replaced by C2F5COOAg and C2F5COOH, respectively, two types of crystals were obtained: yellow block (Ag24-C2F5, 3 h), and black rectangular (Ag70-C2F5, 24 h) crystals.
The structures of the two black crystals (Ag70·Ag12 and Ag70) have been analyzed in a previous work, and Ag70-C2F5 has the same structure (except for the different R′COO− ligands) and similar cell parameters as Ag70; for more details please see ref. 14. The molecular structures of colorless (Ag14, formula Ag14(SiPr)6(CF3COO)8(DMF)6) and yellow block crystals (Ag24/Ag24-C2F5, formula Ag24S(SiPr)8(R′COO)10(DMF)8 · 2(NH2(CH3)2R′COO), R′ = –CF3 or –C2F5) were determined by single-crystal X-ray diffraction (SCXRD) analysis (Tables S1–S3†) and elemental analysis. The structure of the {Ag25S} species observed in ESI-MS should be Ag24 without DMF molecules, whose exposed parts are covered by additional CF3COO− and CF3COOAg.
Ag14 features an ellipsoidal Ag(i) cluster (Fig. S11†). Except that the middle silver ring expands from six to eight Ag atoms, the silver–sulfur framework of Ag14 is similar to that of Ag12 in Ag70·Ag12 (Fig. S11†).14
Considering the structural similarity between Ag24 and Ag24-C2F5 (Fig. S12†), Ag24 was selected as the representative for illustration (Fig. 3). Ag24 crystallizes in a triclinic space group (P1̄) and possesses half a cluster in the asymmetric unit (Fig. S12†). As is shown in Fig. 3a, the total structure of Ag24 presents a long strip shape, composed of one sulfur atom, 24 silver atoms, and organic ligands (eight SiPr−, ten CF3COO− and ten DMF molecules). The size of the “shuttle”-like S@Ag24 framework (Fig. 3b) is 4.6 × 4.6 × 12.9 Å3. The μ4-S2− located in the inversion center (Fig. S13†) originates from the breaking of the S–C bond of SiPr−, and serves as an anion template here. The S2−-template gathers 14 silver atoms together to form a slightly twisted cube (μ4-S@Ag14, Fig. 3d and S14a†), where Ag atoms occupy the vertices and the center of the faces (Ag–S bond lengths: 2.537(2) and 2.621(4) Å; the distances of Ag⋯Ag: 3.212(4) to 3.464(4) Å, Table S3†). Interestingly, two classical Ag6 octahedra appear on both sides of the above polyhedron (Fig. 3c and S14b†). The three parts merge into the final skeleton (Ag(S@Ag14)⋯Ag(Ag6): 3.057(3) to 3.171(3) Å) by sharing silver atoms (Fig. 3b). The 8 SiPr− ligands with a μ4 mode, located at the junction of the S@Ag14 fragment and the Ag6 motifs, hold them firmly together (Fig. S13†). The Ag–S(SiPr−) bond lengths are located in the range of 2.395(6) to 2.576(9) Å (Table S3†). Due to differences in location, the 10 CF3COO− ligands are divided into two types (Fig. 3a and S15†): (i) the four with μ2-η1:η1 or μ3-η1:η2 modes cap at the waist; (ii) the six with μ2-η1:η1 mode cover the Ag6. The Ag–O(CF3COO−) bond lengths span from 2.26(4) to 2.72(2) Å. Ten additional DMF molecules finally finish the outer organic shell (Ag–O(DMF) bond: 2.27(3) to 2.87(6) Å) to protect and stabilize the S@Ag24 kernel (Fig. S16†).
It is worth noting that the Ag⋯Ag distances of Ag6 species range from 2.767(4) to 2.853(3) Å with an average of 2.805 Å (Fig. 3e), which is shorter than others (3.057(3) to 3.464(4) Å) of Ag24 and those of metallic Ag (2.88 Å), indicating the presence of significantly stronger argentophilic interactions. The Ag⋯Ag distances of the Ag6 fragments in Ag24 are comparable to those of reported Ag64+ cores with similar configurations (2.66–2.87 Å),10b,16 but shorter than those of Ag66+ octahedra (2.85–3.44 Å, Table S4†).10c,17 Therefore, the Ag6 kernels in Ag24 should also be Ag64+ with two delocalized electrons. Moreover, unlike previously reported Ag64+ octahedra located in the center of the Ag clusters, two Ag64+ fragments in Ag24 are on the periphery and stabilized by weak Ag–O bonds (2.27(3) to 2.63(7) Å, Fig. 3f), suggesting that this cluster is highly reactive.
When the Ag24 crystals were dissolved in CH2Cl2, no obvious signal appeared in the ESI-MS spectra. An additional amount of DMF (Fig. S17†) or iPrOH (Fig. S18†) was introduced, and the ESI-MS spectra showed a series of Ag24-related peaks (1a–1i, Tables S5; and 2a–2n, S6†) in both positive and negative ion modes, including the high intensity peak assigned to [NH2(CH3)2]4[Ag25S(SiPr)8(CF3COO)16]− (2d, calcd m/z = 5322.83) in the mother liquor. These groups of peaks showed strong correlation, which indicated that different numbers of small ions and/or molecules (Ag+, NH2(CH3)2+, and CF3COO−) were attached to the main structure [Ag24S(SiPr)8(CF3COO)10] (Fig. S17f and S18d†). So, Ag24 is a rare 4e cluster (n = 24–2–8–10) with two independent 2e delocalized Ag64+ based on the above SCXRD and ESI-MS analysis.
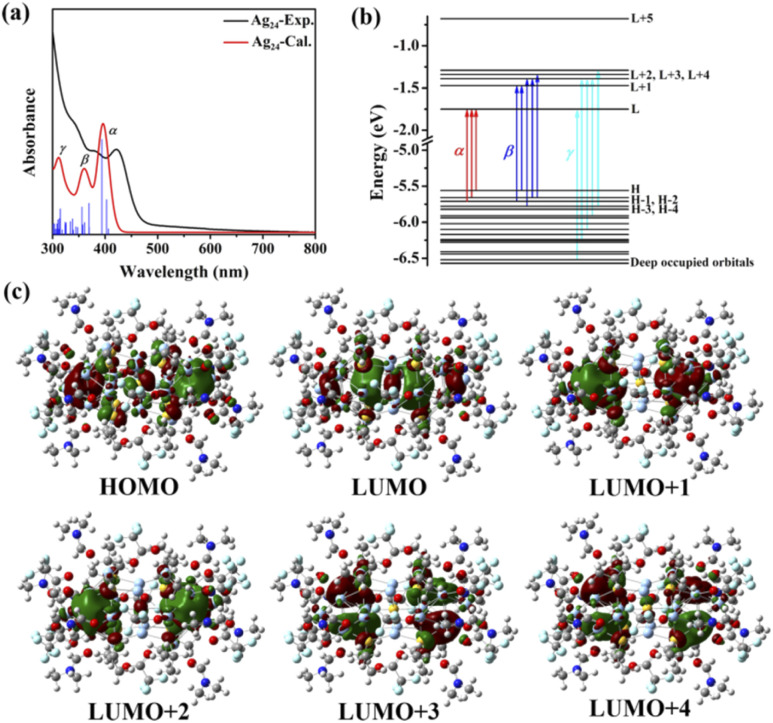
The UV-vis spectrum of Ag24 showed three prominent optical absorption bands at 345, 377 and 422 nm (Fig. 4a). To reveal the electronic structure of Ag24, we carried out density functional theory (DFT) and time-dependent density functional theory (TD-DFT) calculations. The calculated spectrum correlated well with the experimental one, and the details of the transitions (α, β, γ; Fig. 4b and S19–S26†) are summarized in Table S7.† The α, β, and γ peaks correspond to HOMO−2/HOMO−1/HOMO → LUMO, HOMO−3/HOMO−2/HOMO−1/HOMO → LUMO+1/LUMO+2/LUMO+3, and HOMO−15/HOMO−10/HOMO−8/HOMO−5/HOMO−3 → LUMO/LUMO+2/LUMO+4 transitions, respectively. The HOMO is composed of two spherical harmonics with S character, originating at the two Ag64+ centers, while the LUMO, LUMO+1/+2, and LUMO+3/+4 states show 1P symmetry at Ag64+ (Fig. 4c).10b,16g
Fig. 4. UV-vis absorption spectra and DFT of Ag24. (a) Experimental (black) and calculated (red) absorption spectra of Ag24 in CH2Cl2. (b) The Kohn–Sham orbital energy level of Ag24. (c) Frontier orbitals including HOMO, LUMO, LUMO+1, LUMO+2, LUMO+3 and LUMO+4 of Ag24.
The determination of the key intermediate
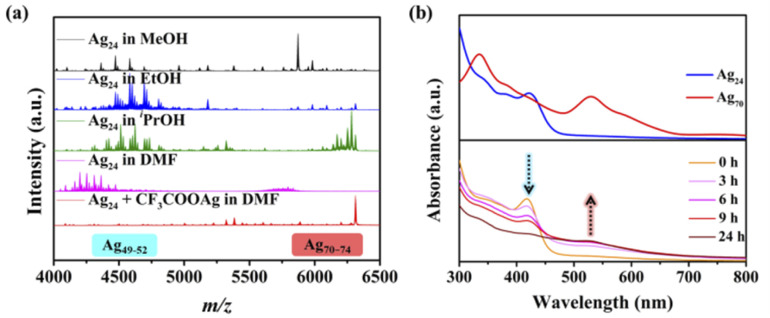
Whether Ag24 is an intermediate in the formation of Ag70 is the most important issue to reveal the structural evolution and size expansion during the reduction process. To solve this confusion, we tried to obtain the final product (Ag70) with Ag24 crystals as the raw material. When the yellow crystals of Ag24 were dissolved in MeOH (Video S1†), EtOH or iPrOH, the color of the solution turned red or brown within 5 s. This means that upon stimulation by solvent molecules, the surface ligands of the highly active Ag24 were removed, and the more active species clustered to assemble into larger aggregates instead of disintegrating. The ESI-MS spectra of the obtained solution (Fig. 5a and S27†) confirmed the formation of larger species including Ag70, which directly confirmed that Ag24 was a necessary intermediate in the formation of Ag70, rather than a simple unrelated kinetic product. The medium-sized {Ag49–52} species observed in the transition process arise as a result of the fragmentation of Ag70.14 Additional CF3COOAg molecules can inhibit the formation of these fragments (Fig. 5a).
Fig. 5. Tracking the transformation process from Ag24 to Ag70 by ESI-MS and UV-vis spectroscopy. (a) Negative-ion mode ESI-MS spectra of Ag24 in different solutions. (b) Top: UV-vis absorption spectra of Ag24 (dissolved in CH2Cl2) and Ag70 (dissolved in DMF); Bottom: time-dependent UV-vis absorption spectra of Ag24 dissolved in DMF for tracking the transformation process from Ag24 (yellow solution) to Ag70 (red solution).
Time-dependent absorption spectra (Fig. 5b) are used to track and monitor the transformation process from Ag24 (prominent peaks in CH2Cl2: 345, 377 and 422 nm) to Ag70 (distinct absorption bands: 335, 386, 426, 530, and 595 nm in DMF). From 0 h to 6 h, the absorption peaks of 400–450 nm and below 400 nm were attenuated, and the absorption between 450 and 800 nm was enhanced gradually. After 6 h, the spectrum showed three distinct peaks at 340, 423 and 530 nm, and the solution color was changed from yellow to red. Furthermore, ESI-MS was used to analyze the products of the structural conversion (Fig. S28†), and the results were similar to the ESI-MS spectra of Ag24 dissolved in MeOH. This transition process (Ag24 → Ag70) was slowed down in DMF, possibly due to the presence of a large number of DMF molecules on the cluster surface, which passivated the active Ag64+ core.
Evolution route from Ag24 to Ag70
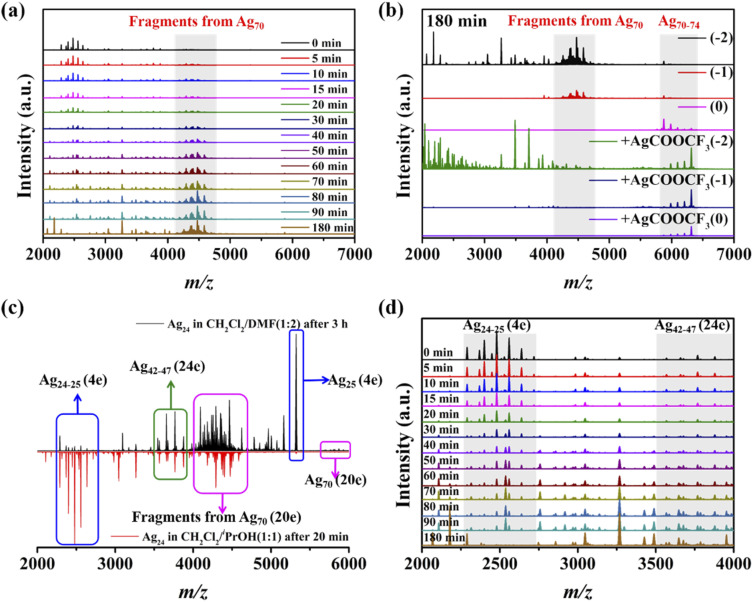
The growth process of small Ag24 to Ag70 by self-reaction is crucial for understanding and controlling the preparation of large-sized Ag nanoclusters. Initial attempts using ESI-MS to identify reaction intermediates in an alcohol solution were unsuccessful because the transition reaction was completed quickly (<1 min). To suppress the reaction kinetics of the system, we tried to trigger reactions of Ag24 to Ag70 with mixed solvents (such as CH2Cl2 and MeOH, Video S2†). After much trial and error, suitable real-time ESI-MS spectra were obtained for the systems of CH2Cl2 + iPrOH (1 : 1, Fig. 6) and CH2Cl2 + DMF (1 : 2, Fig. S29†). As shown in Fig. 6, with the reaction going on, it was clear that the peak intensity of {Ag24–25S} (4e) with two negative charges in the m/z = 2250–2750 decreases continuously, while the peaks of Ag70 began to appear slowly and strengthen. By adjusting the collision voltages and adding CF3COOAg, it was proved that the group peaks in the m/z = 4100–4900 were the result of the fragmentation of the Ag70 cluster (Fig. 6a and b). The two systems have similar peak groups and changing trends in negative ion mode ESI-MS (Fig. 6c and S29†). In the positive ion mode ESI-MS, no new peaks appeared in the CH2Cl2/iPrOH system, while in CH2Cl2/DMF, there were new peaks in the m/z = 4200–4800 denoted as {[NH2(CH3)2]10+xAg18+yS(SiPr)5(CF3COO)12+x+y(DMF)]}+ (x = 0–3, y = 0–1, Fig. S29b–d and Table S8†), containing 8 free valence electrons. The peaks (4a–4i) with two negative charges in the m/z = 3500–4000 were assigned to {[NH2(CH3)2]8[Ag42+xS4(SiPr)11(CF3COO)9+x]}2− (x = 0–5, Fig. S30 and Table S9†) containing 24 free valence electrons. The highly reduced {Ag42–47S4} (24e) species with four S2− anions may have formed an initial AgnS4 core similar to the Ag70 (20e) cluster. Compared to Ag70 ([Ag70S4(SiPr)24(CF3COO)20]2−), the inconsistent electron numbers, and missing metal atoms and ligands of {Ag42–47S4} (24e) suggest that they may still need to undergo oxidation or local decomposition, and further Ag–S shell reconstruction to form the final products. It is worth noting that there are still some peaks that are not assigned properly due to the complexity of the system.
Fig. 6. Time-dependent ESI-MS spectra from Ag24 to Ag70 dissolved in the solvent mixture (iPrOH : CH2Cl2 = 1 : 1). (a) Time-dependent negative ion mode ESI-MS (collision energy: 2 V) in the range of m/z = 2000–7000 of Ag24 for tracking the transformation process from Ag24 to Ag70. (b) ESI-MS data at different collision voltages (0, 1, 2 V) after Ag24 was dissolved in the solvent mixture (iPrOH : CH2Cl2 = 1 : 1) for three hours, and ESI-MS data after adding CF3COOAg salt as a comparison. (c) Comparison of the transformation process from Ag24 to Ag70 in different solvents. (d) Time-dependent negative ion mode ESI-MS (collision energy: 2 V) in the range of m/z = 2000–4000, highlighting some key intermediates.
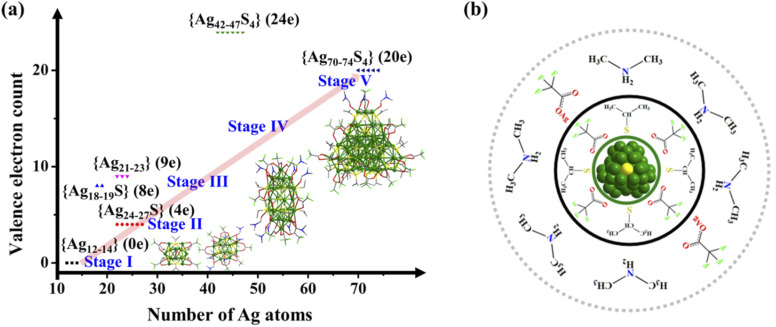
Based on the above observations and analysis, a reasonable stepwise bottom-up evolution route of Ag70 (Fig. 7a) is provided, including five stages: stage I, small molecules (CF3COOAg and AgSiPr) aggregate to form stable monovalent clusters, such as {Ag12–14}; stage II, at a certain acidity, DMF serving as both a mild reducing reagent and an organic reaction medium effectively reduces small Ag fragments (such as [NH2(CH3)2]x[Ag12+y(SiPr)6(CF3COO)7+x+y]− (x = 0–4, y = 0–3, {Ag12–15} (0e)), Fig. S7–S9†) to classical face-centered cubic (fcc) Ag64+ species. The Ag64+ reducing fragments are passivated by S2− templates in situ generated from the breaking of the S–C bond of organic ligands, forming relatively stable {Ag24–27S} (4e) clusters containing a S@(Ag6)2 skeleton (Fig. 2 and S17, S18†); stage III, Ag24 disintegrate and recombine to form intermediates with more free electrons, such as {[NH2(CH3)2]3[Ag21+x(SiPr)5(CF3COO)11+x]}− (x = 0–2, {Ag21–23} (9e), Fig. 2 and S7–S9†) and {[NH2(CH3)2]10+xAg18+yS(SiPr)5(CF3COO)12+x+y(DMF)]}+ (x = 0–3, y = 0–1, {Ag18–19S} (8e), Fig. S29†); stage IV, the small reducing products described above assemble and fuse together to form 4 S2−-passivated preliminary products, {[NH2(CH3)2]8[Ag42+xS4(SiPr)11(CF3COO)9+x]}2− (x = 0–5, {Ag42–47S4} (24e), Fig. S30 and Table S9†); stage V, on the basis of {Ag42–47S4} (24e), oxidation or localized decomposition occurs and extra small molecules accumulate on the surface to form the final product Ag70 (Fig. S31†) with a multi-S2−-passivated Ag288+ kernel (20e) possessing an fcc Ag16 inner core. It can be seen that the formation process of Ag70 nanoclusters is different from that of typical Ag NCs (lowly reduced species with a similar number of metal as the product is formed first, and is further reduced) and Au NCs (step-by-step formation process).11
Fig. 7. Schematic illustration of the growth process of Ag70 and the general structure of related species. (a) Schematic illustration of the growth process. Five stages dominated by different reaction processes are shown. Stage I: aggregate; stage II: reduction; stage III: decomposition and recombination; stage IV: fusion and stage V: surface recombination and motif enrichment. (b) General structure of relevant clusters during the synthesis of Ag70: Ag–S cores of relevant clusters are protected by organic ligands; [NH2(CH3)2]+ ions and CF3COOAg molecules are attached to the periphery.
Interestingly, these observed intermediate species and products have similar structural features (Fig. 7b): the silver or silver–sulfur framework protected by organic ligands (CF3COO− and SiPr−) is always enriched with some [NH2(CH3)2]+ ions and CF3COOAg molecules based on electrostatic and hydrogen bonding interactions at the periphery. The introduction of additional [NH2(CH3)2]+ cations can significantly improve yields, as do other similar amine cations. These species are critical for stabilizing intermediates and forming products. Uncovering the formation process of this medium-scale nanocluster is of great importance since it maps out a reasonable and common avenue for the generation and expansion of the fcc metal kernel in metal nanoclusters.
Conclusions
In summary, the reaction process of Ag70 was traced by time-dependent UV-vis spectroscopy and ESI-MS. The intermediates (Ag14 and Ag24) were crystallized successfully by controlling the reaction time. A reasonable path from Ag+ species (such as Ag14) to Ag24 (skeleton: S@(Ag64+)2), and then to Ag70 (multi-S2− induced kernel: Ag288+) has been mapped out. The detailed process of bottom-up assembly from Ag24 to Ag70 was successfully revealed by real-time ESI-MS. The evolutionary route suggests that small cations for stabilization and highly reactive reducing species are critical for the formation of large-sized Ag NCs. Overall, this work presents a reasonable avenue for comprehending the generation and expansion of an fcc core in metal NCs, and provides some guidance for controlled synthesis of NCs and nanoparticles in the future.
Data availability
All the data supporting this article have been included in the main text and the ESI.† The X-ray crystallographic coordinates for structures reported inthis article have been deposited at the Cambridge Crystallographic Data Centre (CCDC) under deposition numbers CCDC: 2182448, 2182449, and 2182450.
Author contributions
S. Q. Z. conceived and designed the experiments. X. M. L. and S. H. conducted the synthesis and characterization. X. M. L. drew the pictures in the manuscript. S. Q. Z., X. Y. D. and X. M. L. analysed the experimental results. X. M. L. and K. M. completed crystallographic data collection and refinement of the structure. P. L. performed the calculations. Z. Y. W. helped to revise the writing. X. M. L., X. Y. D., and S. Q. Z. co-wrote the manuscript.
Conflicts of interest
There are no conflicts to declare.
Supplementary Material
Acknowledgments
This work was supported by the National Natural Science Foundation of China (No. 21825106, U21A20277, 92061201, and 21975065) and Zhengzhou University.
Electronic supplementary information (ESI) available: Fig. S1–S31 and Tables S1–S9 for experimental details, detailed crystallographic structures, DFT, UV, ESI-MS, and crystal data of nanoclusters. CCDC 2182448, 2182449, and 2182450. For ESI and crystallographic data in CIF or other electronic format see https://doi.org/10.1039/d2sc04204e
References
- (a) Li Y. Zhou M. Song Y. Higaki T. Wang H. Jin R. Nature. 2021;594:380–384. doi: 10.1038/s41586-021-03564-6. [DOI] [PubMed] [Google Scholar]; (b) Yao Q. Chen T. Yuan X. Xie J. Acc. Chem. Res. 2018;51:1338–1348. doi: 10.1021/acs.accounts.8b00065. [DOI] [PubMed] [Google Scholar]
- (a) Jin Y. Zhang C. Dong X.-Y. Zang S.-Q. Mak T. C. W. Chem. Soc. Rev. 2021;50:2297–2319. doi: 10.1039/d0cs01393e. [DOI] [PubMed] [Google Scholar]; (b) Xie Y.-P. Jin J.-L. Duan G.-X. Lu X. Mak T. C. W. Coord. Chem. Rev. 2017;331:54–72. [Google Scholar]
- (a) Fuhr O. Dehnen S. Fenske D. Chem. Soc. Rev. 2013;42:1871–1906. doi: 10.1039/c2cs35252d. [DOI] [PubMed] [Google Scholar]; (b) Zhang M.-M. Dong X.-Y. Wang Y.-J. Zang S.-Q. Mak T. C. W. Coord. Chem. Rev. 2022;453:214315. [Google Scholar]
- Chakraborty I. Pradeep T. Chem. Rev. 2017;117:8208–8271. doi: 10.1021/acs.chemrev.6b00769. [DOI] [PubMed] [Google Scholar]
- Li Y. Higaki T. Du X. Jin R. Adv. Mater. 2020;32:1905488. doi: 10.1002/adma.201905488. [DOI] [PubMed] [Google Scholar]
- Kang X. Zhu M. Chem. Soc. Rev. 2019;48:2422–2457. doi: 10.1039/c8cs00800k. [DOI] [PubMed] [Google Scholar]
- (a) Yan J. Teo B. K. Zheng N. Acc. Chem. Res. 2018;51:3084–3093. doi: 10.1021/acs.accounts.8b00371. [DOI] [PubMed] [Google Scholar]; (b) Jin R. Li G. Sharma S. Li Y. Du X. Chem. Rev. 2021;121:567–648. doi: 10.1021/acs.chemrev.0c00495. [DOI] [PubMed] [Google Scholar]
- Huang R. W. Wei Y. S. Dong X. Y. Wu X. H. Du C. X. Zang S. Q. Mak T. C. W. Nat. Chem. 2017;9:689–697. doi: 10.1038/nchem.2718. [DOI] [PubMed] [Google Scholar]
- (a) Zhao X. Zang S.-Q. Chen X. Chem. Soc. Rev. 2020;49:2481–2503. doi: 10.1039/d0cs00093k. [DOI] [PubMed] [Google Scholar]; (b) Nasaruddin R. R. Chen T. Yao Q. Zang S. Xie J. Coord. Chem. Rev. 2021;426:213540. [Google Scholar]
- (a) Li Q. Huang B. Yang S. Zhang H. Chai J. Pei Y. Zhu M. J. Am. Chem. Soc. 2021;143:15224–15232. doi: 10.1021/jacs.1c06354. [DOI] [PubMed] [Google Scholar]; (b) Luo X.-M. Gong C.-H. Dong X.-Y. Zhang L. Zang S.-Q. Nano Res. 2021;14:2309–2313. [Google Scholar]; (c) Gao M.-Y. Wang K. Sun Y. Li D. Song B.-Q. Andaloussi Y. H. Zaworotko M. J. Zhang J. Zhang L. J. Am. Chem. Soc. 2020;142:12784–12790. doi: 10.1021/jacs.0c05199. [DOI] [PubMed] [Google Scholar]; (d) Zhong Y.-J. Liao J.-H. Chiu T.-H. Kahlal S. Lin C.-J. Saillard J.-Y. Liu C. W. Angew. Chem., Int. Ed. 2021;60:12712–12716. doi: 10.1002/anie.202100965. [DOI] [PubMed] [Google Scholar]
- (a) Cao Y. Chen T. Yao Q. Xie J. Acc. Chem. Res. 2021;54:4142–4153. doi: 10.1021/acs.accounts.1c00481. [DOI] [PubMed] [Google Scholar]; (b) Cao Y. Liu T. Chen T. Zhang B. Jiang D.-e. Xie J. Nat. Commun. 2021;12:3212. doi: 10.1038/s41467-021-23568-0. [DOI] [PMC free article] [PubMed] [Google Scholar]; (c) Cao Y. Fung V. Yao Q. Chen T. Zang S. Jiang D.-e. Xie J. Nat. Commun. 2020;11:5498. doi: 10.1038/s41467-020-19327-2. [DOI] [PMC free article] [PubMed] [Google Scholar]; (d) Yao Q. Yuan X. Fung V. Yu Y. Leong D. T. Jiang D.-e. Xie J. Nat. Commun. 2017;8:927. doi: 10.1038/s41467-017-00970-1. [DOI] [PMC free article] [PubMed] [Google Scholar]; (e) Luo Z. Nachammai V. Zhang B. Yan N. Leong D. T. Jiang D.-e. Xie J. J. Am. Chem. Soc. 2014;136:10577–10580. doi: 10.1021/ja505429f. [DOI] [PubMed] [Google Scholar]; (f) Chen T. Fung V. Yao Q. Luo Z. Jiang D.-e. Xie J. J. Am. Chem. Soc. 2018;140:11370–11377. doi: 10.1021/jacs.8b05689. [DOI] [PubMed] [Google Scholar]; (g) Cao Y. Guo J. Shi R. Waterhouse G. I. N. Pan J. Du Z. Yao Q. Wu L.-Z. Tung C.-H. Xie J. Zhang T. Nat. Commun. 2018;9:2379. doi: 10.1038/s41467-018-04837-x. [DOI] [PMC free article] [PubMed] [Google Scholar]
- Lei Z. Li J.-J. Nan Z.-A. Jiang Z.-G. Wang Q.-M. Angew. Chem., Int. Ed. 2021;60:14415–14419. doi: 10.1002/anie.202103290. [DOI] [PubMed] [Google Scholar]
- (a) Huang J.-H. Si Y. Dong X.-Y. Wang Z.-Y. Liu L.-Y. Zang S.-Q. Mak T. C. W. J. Am. Chem. Soc. 2021;143:12439–12444. doi: 10.1021/jacs.1c05568. [DOI] [PubMed] [Google Scholar]; (b) Liu X. Saranya G. Huang X. Cheng X. Wang R. Chen M. Zhang C. Li T. Zhu Y. Angew. Chem., Int. Ed. 2020;59:13941–13946. doi: 10.1002/anie.202005087. [DOI] [PubMed] [Google Scholar]; (c) Hu F. Li J.-J. Guan Z.-J. Yuan S.-F. Wang Q.-M. Angew. Chem., Int. Ed. 2020;59:5312–5315. doi: 10.1002/anie.201915168. [DOI] [PubMed] [Google Scholar]; (d) Hu F. Guan Z.-J. Yang G. Wang J.-Q. Li J.-J. Yuan S.-F. Liang G.-J. Wang Q.-M. J. Am. Chem. Soc. 2021;143:17059–17067. doi: 10.1021/jacs.1c06716. [DOI] [PubMed] [Google Scholar]
- Luo X.-M. Gong C.-H. Pan F. Si Y. Yuan J.-W. Asad M. Dong X.-Y. Zang S.-Q. Mak T. C. W. Nat. Commun. 2022;13:1177. doi: 10.1038/s41467-022-28893-6. [DOI] [PMC free article] [PubMed] [Google Scholar]
- Du M.-H. Chen L.-Q. Jiang L.-P. Liu W.-D. Long L.-S. Zheng L. Kong X.-J. J. Am. Chem. Soc. 2022;144:5653–5660. doi: 10.1021/jacs.2c01502. [DOI] [PubMed] [Google Scholar]
- (a) Liang X.-Q. Li Y.-Z. Wang Z. Zhang S.-S. Liu Y.-C. Cao Z.-Z. Feng L. Gao Z.-Y. Xue Q.-W. Tung C.-H. Sun D. Nat. Commun. 2021;12:4966. doi: 10.1038/s41467-021-25275-2. [DOI] [PMC free article] [PubMed] [Google Scholar]; (b) Deng G. Malola S. Yuan P. Liu X. Teo B. K. Häkkinen H. Zheng N. Angew. Chem., Int. Ed. 2021;60:12897–12903. doi: 10.1002/anie.202101141. [DOI] [PubMed] [Google Scholar]; (c) Das A. K. Mekkat R. Maity S. Nair A. S. Bhandary S. Bhowal R. Patra A. Pathak B. Chopra D. Mandal S. Inorg. Chem. 2021;60:19270–19277. doi: 10.1021/acs.inorgchem.1c03083. [DOI] [PubMed] [Google Scholar]; (d) Wang Z. Qu Q.-P. Su H.-F. Huang P. Gupta R. K. Liu Q.-Y. Tung C.-H. Sun D. Zheng L.-S. Sci. China: Chem. 2020;63:16–20. [Google Scholar]; (e) Sun Q. Nie H.-H. Su H.-F. Yang S.-Y. Teo B. K. Inorg. Chem. 2020;59:8836–8845. doi: 10.1021/acs.inorgchem.0c00592. [DOI] [PubMed] [Google Scholar]; (f) Wang Z. Yang F.-L. Yang Y. Liu Q.-Y. Sun D. Chem. Commun. 2019;55:10296–10299. doi: 10.1039/c9cc05044b. [DOI] [PubMed] [Google Scholar]; (g) Wang Z.-Y. Wang M.-Q. Li Y.-L. Luo P. Jia T.-T. Huang R.-W. Zang S.-Q. Mak T. C. W. J. Am. Chem. Soc. 2018;140:1069–1076. doi: 10.1021/jacs.7b11338. [DOI] [PubMed] [Google Scholar]; (h) Wang Z. Su H.-F. Kurmoo M. Tung C.-H. Sun D. Zheng L.-S. Nat. Commun. 2018;9:2094. doi: 10.1038/s41467-018-04499-9. [DOI] [PMC free article] [PubMed] [Google Scholar]; (i) Chen S. Fang W.-H. Zhang L. Zhang J. Angew. Chem., Int. Ed. 2018;57:11252–11256. doi: 10.1002/anie.201804569. [DOI] [PubMed] [Google Scholar]; (j) Yang H. Lei J. Wu B. Wang Y. Zhou M. Xia A. Zheng L. Zheng N. Chem. Commun. 2013;49:300–302. doi: 10.1039/c2cc37347e. [DOI] [PubMed] [Google Scholar]; (k) Kikukawa Y. Kuroda Y. Suzuki K. Hibino M. Yamaguchi K. Mizuno N. Chem. Commun. 2013;49:376–378. doi: 10.1039/c2cc37591e. [DOI] [PubMed] [Google Scholar]; (l) Yonesato K. Ito H. Itakura H. Yokogawa D. Kikuchi T. Mizuno N. Yamaguchi K. Suzuki K. J. Am. Chem. Soc. 2019;141:19550–19554. doi: 10.1021/jacs.9b10569. [DOI] [PubMed] [Google Scholar]; (m) Deng G. Teo B. K. Zheng N. J. Am. Chem. Soc. 2021;143:10214–10220. doi: 10.1021/jacs.1c03251. [DOI] [PubMed] [Google Scholar]; (n) Deng G. Malola S. Yuan P. Liu X. Teo B. K. Hakkinen H. Zheng N. Angew. Chem., Int. Ed. 2021;60:12897–12903. doi: 10.1002/anie.202101141. [DOI] [PubMed] [Google Scholar]; (o) Chen S. Fang W. H. Zhang L. Zhang J. Angew. Chem., Int. Ed. 2018;57:11252–11256. doi: 10.1002/anie.201804569. [DOI] [PubMed] [Google Scholar]
- (a) Wang Z. Liu J.-W. Su H.-F. Zhao Q.-Q. Kurmoo M. Wang X.-P. Tung C.-H. Sun D. Zheng L.-S. J. Am. Chem. Soc. 2019;141:17884–17890. doi: 10.1021/jacs.9b09460. [DOI] [PubMed] [Google Scholar]; (b) Han Z. Dong X.-Y. Luo P. Li S. Wang Z.-Y. Zang S.-Q. Mak Thomas C. W. Sci. Adv. 2020;6:eaay0107. doi: 10.1126/sciadv.aay0107. [DOI] [PMC free article] [PubMed] [Google Scholar]
Associated Data
This section collects any data citations, data availability statements, or supplementary materials included in this article.
Supplementary Materials
Data Availability Statement
All the data supporting this article have been included in the main text and the ESI.† The X-ray crystallographic coordinates for structures reported inthis article have been deposited at the Cambridge Crystallographic Data Centre (CCDC) under deposition numbers CCDC: 2182448, 2182449, and 2182450.


