Abstract
Convection-enhanced delivery (CED) is an investigational method for delivering therapeutics directly to the brain for the treatment of glioblastoma. However, it has not become a common clinical therapy due to an inability of CED treatments to deliver therapeutics in a large enough tissue volume to fully saturate the target region. We have recently shown that the combination of controlled catheter movement and constant pressure infusions can be used to significantly increase volume dispersed (Vd) in an agarose gel brain tissue phantom. In the present study, we develop a computational model to predict Vd achieved by various retraction rates with both constant pressure and constant flow rate infusions. An increase in Vd is achieved with any movement rate, but increase in Vd between successive movement rates drops off at rates above 0.3–0.35 mm/min. Finally, we found that infusions with retraction result in a more even distribution in concentration level compared to the stationary catheter, suggesting a potential increased ability for moving catheters to have a therapeutic impact regardless of the required therapeutic concentration level.
Keywords: agarose gel, biphasic finite element analysis, constant pressure infusion, controlled catheter movement, convection-enhanced delivery
Graphical Abstract
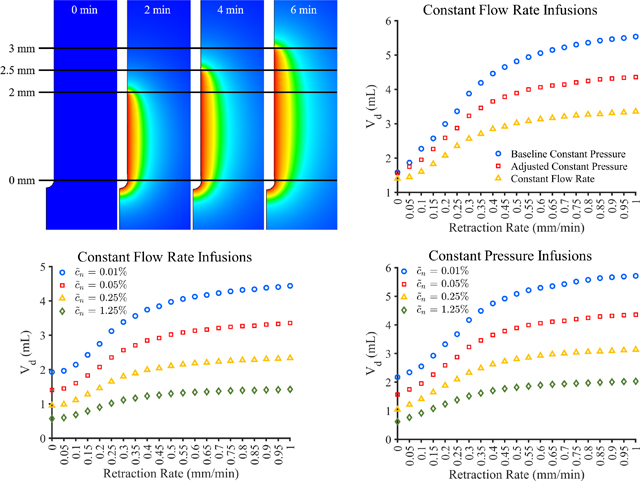
The use of controlled catheter movement for convection-enhanced delivery (CED) at any retraction rate was found to result in an increase in volume dispersed (Vd). Furthermore, the use of constant pressure infusion protocols instead of constant flow rate protocols allowed for an increase in infusion flow rate with catheter retraction distance resulting in an additional increase in Vd. Lastly, infusions with retraction resulted in a more even distribution in concentration level compared to stationary catheters.
1 |. INTRODUCTION
Glioblastoma (GBM) is the most common malignant brain tumor and comprises about 48.3% of all malignant tumors.1 GBM is highly infiltrative, mitotically active, and necrosis-prone resulting in its World Health Organization (WHO) Grade IV designation.2 Current standard of care therapy includes maximal possible resection followed with radiation therapy and concurrent and/or adjuvant chemotherapy.3 Despite the use of aggressive treatment strategies, tumor recurrence is unavoidable and generally presents at or near the original tumor site.4,5 This results in a median survival of only 12–15 months6 and a low 5-year survival of 6.8%.1
Treatment of GBM is severely complicated by the infiltrative nature of the tumor, resulting in the presence of tumorous cells centimeters beyond the distinct visible boundaries shown on magnetic resonance (MR) scans,7 making complete resection of the tumor impossible. Additionally, the presence of the blood–brain barrier (BBB) and blood–brain-tumor barrier (BBTB) inhibit the systemic delivery of therapeutic agents. The BBB prevents the transport of 98% of small molecule drugs with a molecular mass of under 400–500 Da.8 While high-grade gliomas, like GBM, disrupt the BBB, forming a leaky BBTB, the local disturbance of the BBB is unlikely to allow significant amounts of therapeutics to enter the brain. This is further complicated by the highly infiltrative nature of high-grade gliomas which results in the presence of tumorous cells far outside of the disrupted BBB.9
One method that can be employed to overcome the BBB and BBTB is the use of convection-enhanced delivery (CED) proposed by Bobo et al.10 CED utilizes pressure-driven flow to deliver large amounts of therapeutics directly to the brain. In CED, a small caliber catheter is placed through a burr hole in the skull and deployed directly into the brain parenchyma.10 CED appeared to be an extremely promising treatment modality through pre-clinical11,12 and Phase I and II clinical trials13–16; however, the Phase III (PRECISE) clinical trials failed to meet their clinical endpoints.17 A retrospective study conducted by Sampson et al. concluded that drug delivery to tissue at risk for tumor recurrence was inadequate with drug coverage of only 20.1% of the 2 cm tumor margins.18 The poor drug coverage, aggressive endpoints, and a better than expected response from the control arm combined to result in the failure of the only completed Phase III CED clinical trial for treatment of GBM to date.
As a result of Sampson et al.’s findings, focus was placed on the improvement of catheter design. From this, attention was placed on two major design areas: (1) reflux preventing catheters, and (2) multi-port catheters. While less popular for the treatment of GBM, some groups have proposed catheter modifications in order to create elongated infusion geometries specifically to target the putamen for treatment of Parkinson’s disease. Breeze et al. was the first to propose the use of catheter retraction while infusing fetal tissue for the treatment of Parkinson’s disease.19 A similar technique employing the deposition of multiple payloads of therapeutics along the same infusion tract has been used in some clinical trials.20–22 The efficacy of the multiple payload approach was tested by Sillay et al. where the authors concluded that advancement of the catheter resulted in less backflow and a larger infusion radius than retraction of the catheter.23 A similar technique, coined “infuse-as-you-go” was recently proposed, which utilizes a multi-step advancement of the catheter in order to cover nearly 15% more of the elongated putamen geometry in non-human primates.24 In a similar attempt, Lewis et al. proposed the use of varying catheter step length inducing controlled reflux to create an elongated infusion geometry and increase the volume dispersed (Vd) based on the catheter step length.25 We have recently shown that controlled catheter retraction at a rate of 0.25 mm/min can result in an increase in Vd by 50% in an agarose gel model.26 Additionally, we have shown that the use of constant pressure infusions coupled with controlled catheter retraction can result in an increase in Vd of 94% and 143% with 0.25 and 0.5 mm/min catheters, respectively.27
Our objective is to use a computational model to parametrically understand the role of catheter retraction rate on the overall efficacy of controlled catheter movement in CED infusions. To this end, we first develop and validate a multi-physics model allowing for the estimation of Vd of indigo carmine dye in an agarose gel brain tissue phantom. We then use this model to explore the effect of catheter movement rate and distance on Vd as well as infusate concentration profile with both constant pressure and constant flow rate infusion conditions.
2 |. MATERIALS AND METHODS
2.1 |. Biphasic-solute material model
The biphasic-solute material model allows for the transport of a solute in porous media via both diffusion and convection and has consistently been used in the literature to model CED. The material model consists of three constituents, the porous solid matrix (α = s), the solvent (α = w), and the solute (α = u). The model is based on incompressible mixture theory and assumes: (1) each constituent is intrinsically incompressible, (2) negligible inertial effects, (3) isothermal conditions, (4) the solute volume fraction is negligible compared to that of the solid and solvent, and (5) the solute and solvent viscosities are negligible compared to the frictional interactions between constituents. The governing equations describing the balance of linear momentum for the mixture, solvent, and solute of a biphasic-solute material was presented by Mauck et al.28:
| (1) |
| (2) |
| (3) |
Where σ is the Cauchy stress tensor, p is the interstitial fluid pressure, is the stress caused by the strain in the solid matrix, is the volume fraction of α, R is the universal gas constant, θ is the absolute temperature, c is the concentration of the solute, and is the diffusive drag force between the α and β. Next, Ateshian et al.29 synthesized the non-zero diffusive drag coefficients as:
| (4) |
Where k is the solvent hydraulic permeability in the solid matrix, D is the diffusivity of the solute in the mixture, and D0 is the diffusivity in free solution. The mass balance of the mixture, solute, and solid are
| (5) |
| (6) |
| (7) |
Where is the velocity of constituent α, is the volumetric flux, is the molar flux, is the solid volume fraction in the reference state and where , where u is the displacement vector. Equations (1), (5), and (6) are the three governing partial differential equations that can be used to solve for the displacement vector, u, the interstitial fluid pressure, p, and the solute concentration, c. Additionally, Equations (2) and (3) can be inverted in order to obtain relations for the solvent and solute fluxes respectively as a function of their driving forces as presented by Ateshian et al.30,31
| (8) |
| (9) |
Where is the hydraulic permeability tensor of the solution, is the true density of the solvent, and are the chemical potentials of the solvent and solute respectively, M is molecular weight, and D is the solute diffusivity tensore in the mixture. Last, the use of the effective pressure , where , and effective concentration , where , in place of the actual pressure, p, and concentration, c, allows for continuity to be enforced across boundaries.e However, it should be noted that our model assumes ideal solubility so the effective concentration reduces to the actual concentration.
In order to conduct a parametric study on needle retraction speed, a material model similar to what was presented by Elenes et al.32 was used. Briefly, the solid matrix was modeled as agarose gel with a solid volume fraction of 0.6% (wt/wt). A neo-Hookean material with a Poisson’s ratio of 0.35 and an elastic modulus of 6000 Pa was used to represent the agarose gel. The neo-Hookean material is an extension of Hooke’s law formulated for large deformations. The Holmes-Mow relation for the strain-dependent hydraulic permeability tensor was reduced to form the relation proposed by Lai and Mow, 33 by setting the power law exponent, β = 0 in Equation (10), consistent with previous studies. 32,34 39
| (10) |
Where k0 is the isotropic hydraulic permeability and given the lack of experimental data, the parameter was determined parametrically and set at 3.5 mm4/N/s which is of the same order of magnitude used previously.32 The non-linear strain dependence parameter M was set to 1, consistent with the range presented in other models.32,34,35,40 Further, the solvent was modeled as indigo carmine dye with a molecular weight of 466 Da, a free diffusivity (D0) of 3.75 × 10⁻⁴ mm2/s, an effective diffusivity (D) of 2.8 × 10⁻⁴ mm2/s, and ideal solubility. Effective diffusivity was determined parametrically, and free diffusivity was selected to be in the range of diffusivity constants predicted by the Stokes–Einstein relation, Wilke–Chang relation,41 and the relation proposed by Reddy and Doraiswamy42 using the known properties of indigo carmine dye, water, and a temperature of 25°C. A summary of the biphasic finite element model parameters used in this study are show in Table 1.
TABLE 1.
Summary of material parameters used in this study
| Parameter | Value |
|---|---|
| Young’s modulus (E) | 6000 Pa |
| Poisson’s ratio (ν) | 0.35 |
| Initial hydraulic permeability (k0) | 3.5 mm4/N/s |
| Non-linear strain dependence parameter (M) | 1 |
| Power law exponent (β) | 0 |
| Solid volume fraction | 0.006 |
| Free diffusivity (D0) | 3.75 × 10⁻⁴ mm2/s |
| Effective diffusivity (D) | 2.8 × 10⁻⁴ mm2/s |
| Effective solubility | 1 |
| Molecular weight (indigo carmine dye) | 466 Da |
| Prescribed pressure — Constant pressure | 850 Pa |
| Minimum pressure — Adjusted constant pressure | 200 Pa |
| Prescribed flow rate (μ)—Constant flow rate | 1 μl/min |
| Initial cavity radius (r0) | 0.18 mm |
| Minimum cavity radius (rmin)—Adjusted constant pressure | 0.09mm |
2.2 |. Model validation
In order to validate the model, we compared results obtained from constant pressure experiments conducted in agarose gel.27 This experiment utilized catheters moving at rates of 0, 0.25, and 0.5 mm/min to infuse indigo carmine dye at an infusion line pressure of 977 Pa (constant pressure infusions) corresponding to the average pressure required to create a flow rate of 1 μl/min with a stationary catheter or a flow rate of 1 μl/min (constant flow rate infusions) for 100 min. The Vd previously reported was compared to the Vd estimated by the computational model at the same concentration threshold of 0.05% discussed in Mehta.27
Vd was calculated by taking all nodes above the concentration threshold of 0.05% of the prescribed concentration. Artifacts from the mesh discretization were removed by linearly interpolating between the last row of nodes above the concentration threshold and the first row of nodes below the threshold in order to find the approximate location of the concentration threshold. Next, we took the convex hull of the linearly interpolated nodes to find the volume of the pseudo two-dimensional infusion. This infusion volume could be multiplied by 120 in order to get the entire three-dimensional Vd and compared to the experimental results. The model was validated by comparing Vd between the experimental results and the computational model results at 20-min intervals. The Vd of the experiment was plotted against the Vd of the model and a best fit line of was imposed on the data. The model was then considered validated if the R 2 value of the best fit line was greater than 0.9, suggesting good agreement between the model and the experiment. After validation, we conducted a parametric analysis exploring different retraction rates ranging from 0 to 1 mm/min and different movement distances ranging from 5 to 25 mm.
2.3 |. Baseline constant pressure model
Similar to the geometry presented by Orozco et al.,43,44 we created a solid model of the porous matrix consisting of a semicircular initial infusion cavity (r = 0.180 mm), corresponding to the outer diameter of the catheter used in the experiment, and a 12 mm semicircular outer boundary beneath a 48 mm tall cylindrical surface, as shown in Figure 1A. The two-dimensional surface was revolved by 3° in order to create a three-dimensional geometry that could be modeled as a pseudo two-dimensional feature. The model was then imported into Gmsh (version 4.4.1, gmsh.info) where a three-dimensional mesh was created using a combination of 8-node trilinear hexahedral and 6-node linear pentahedral elements. The mesh was biased toward the infusion cavity and contained more than 45 k elements. Next, the model was imported into Preview (version 2.1.5, www.febio.org) in order to create the geometry input file for simulation.
FIGURE 1.
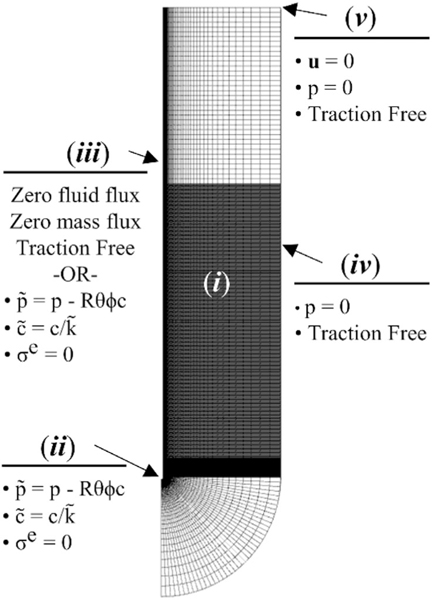
Geometry and boundary conditions used for finite element analysis of retracting catheter infusions (i) porous matrix, (ii) initial infusion cavity, (iii) infusion cavity/catheter surface, (iv) outer tissue boundary, and (v) top surface
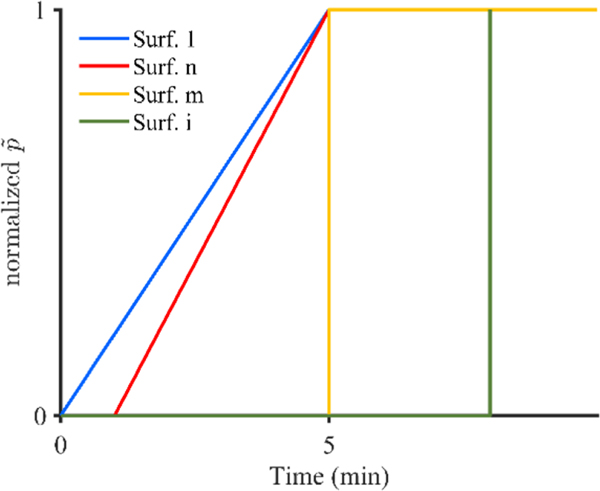
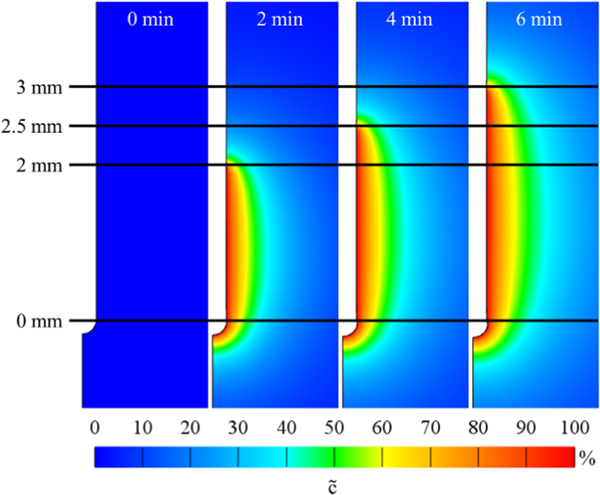
A script was written in Matlab (R2018a, Natick, MA) in order to create the boundary conditions on each surface. Pressure and concentration were applied to the initial infusion cavity (Figure 1B), as well as portions of the catheter cavity (Figure 1C) to model needle movement. In order to best model the conducted experiment, the initial infusion surface included the spherical infusion cavity along with 2 mm of the vertical infusion surface. This was done in order to model the void left by the 2 mm retraction step conducted directly after catheter insertion used to remove any agarose that may have become stuck on the catheter tip. Concentration was applied instantaneously, while effective pressure was applied linearly over the first 5 min of the simulation for surfaces that were active in the first 5 min and effective pressure was applied instantaneously for surfaces that became active after 5 min, as shown in Figure 2. The linear application of pressure was chosen because measured rise time for pressure was 4.5 min in the experiments. Additionally, a zero radial contact stress boundary condition was applied to all free surfaces on the solid matrix at the intersection between the fluid and the porous matrix. Zero-pressure boundary conditions were applied to the outer matrix boundary (Figure 1D) and zero displacement, fluid flux, and mass flux were applied to the top surface (Figure 1E) as well as to the symmetry faces. In order to create needle movement, we used a multi-step analysis in which each needle movement was considered a new analysis step. The initiation time of each new step was determined by the retraction rate and the mesh size. This allowed a new set of boundary conditions to be applied at the initiation of each analysis step allowing for infusion to begin to move up along the needle tract, as shown in Figure 3. The vertical mesh size along the movement surfaces was 0.05 mm; however, catheter movement discretization was 0.5 mm in order to reduce computational cost. The total retraction distance permitted was 25 mm in order to correspond with a maximum initial deployment distance of 30 mm. The arising boundary value problem was solved with FEBio (version 2.9.1, www.febio.org) using the linear pardiso solver and an auto time stepper with an initial time step defined by the needle movement rate.
FIGURE 2.
Schematic of pressure application over time, where Surf 1 represents the initial infusion cavity, Surf n represents an arbitrary surface that becomes active within the first 5 min of infusion, Surf m represents a surface that becomes active at 5 min into the infusion, and Surf i represents and arbitrary surface that becomes active after 5 min of infusion
FIGURE 3.
Images of infusion cavity showing applied effective pressure at 0, 2, 4, and 6 min into an infusion corresponding to infusion cavity lengths of 0, 2, 2.5, and 3 mm, respectively using a catheter retraction rate of 0.25 mm/min
2.4 |. Constant pressure adjusted model
An adjusted model was also created for analysis. This model used the same boundary conditions already stated and added boundary conditions to decrease pressure through the length of the infusion cavity as a function of the distance from the needle tip. This allowed for the reduction in pressure expected as the infusate traveled through the cavity. Additionally, the initial infusion cavity radius was reduced from 0.18 to 0.09 mm. An initial analysis step of 1 s was added where the infusion cavity was expanded to 0.18 mm this was done in order to represent the compressive stress on the tissue caused by the needle. The choice of creating an initial cavity radius of 0.09 mm also allows for the representation of tissue damage caused by needle insertion. Infusion was started as normal at the 1 s mark, and the cavity shrinking, which is expected to occur when the catheter is no longer in a position to force the cavity open, was enforced as a function of needle tip distance from each surface along the cavity. A linear decrease in cavity size was prescribed at locations greater than 2 mm from the current needle tip location reaching a minimum cavity radius of 0.09 mm at distances of 10 mm or greater away from the current needle tip location. Similarly, infusion pressure was prescribed with a maximum pressure of 850 Pa at 2 mm from the current needle tip location linearly decreasing to a minimum pressure of 200 Pa at distances of 10 mm or greater away from the current needle tip location.
2.5 |. Constant flow rate model
Constant infusion flow rates, as typically prescribed in CED infusions, cannot be applied without prior knowledge of infusion fluid flux and either the deformation caused by the infusion pressure or the fluid velocity. In order to overcome this challenge, many models use constant pressure infusion protocols32,34,35 while other models have created a constant flow model by restricting the deformation of the tissue along the infusion cavity.39 The flow rate of infusate into the tissue is based on two components: (1) flow into tissue due to fluid flux, and (2) flow into tissue due to deformation of the infusion cavity. The first component can be determined using Equation (11):
| (11) |
Where is the volume of infusate into the tissue due to flux, is the surface area of each element along the infusing surface, is the fluid flux at each element along the infusing surface, and is the step size at the time of interest. The second component can be calculated as the change in volume of the infusion cavity from the previous time step to the current time step, this can be approximated by computing the difference of the convex hull of the infusion surface for the two adjacent time steps. Next, the total volume of fluid into the tissue can be computed by summing the two volumes as shown in Equation (12):
| (12) |
Where is the total infused volume over the time step and is the change in infusion cavity volume. Finally, the volumetric flow rate, Q, can be computed as shown in Equation (13).
| (13) |
The constant infusion pressure method, was shown to be a fair assumption when using a stationary catheter,32 as tissue deformation is relatively small making negligible after the initial time steps. Further, the surface area, , over which the infusion occurs stays constant after initial deformation allowing for a reasonable calculation of average flow rate as a proxy for the infusion flow rate. However, this method of calculating average flow rate does not hold when a catheter begins to move because the surface area over which flow is occurring grows significantly.
To overcome the inability of a constant infusion pressure to model a constant flow rate, a searching algorithm was used to find the required applied effective pressure that would result in the target flow rate for each time step. An initial guess for the effective pressure is applied instantaneously at the beginning of each analysis time step and the model is executed for that single step. Next, the flow rate is calculated using Equation (13) and compared to the target flow rate. The error between the target and computed flow rate is used to update the guess for applied effective pressure and the analysis step is re-run with the new pressure. When the difference in applied effective pressure is within 1 Pa between successive iterations, the problem is considered converged and the algorithm ends. The final effective pressure then becomes the optimal pressure for that time step and the algorithm restarts at the next time point. As a result, the prescribed infusion pressure becomes time dependent and yields a nearly constant infusion flow rate. All other boundary conditions are chosen to be the same as the baseline constant pressure model.
2.6 |. Mesh sensitivity
A mesh density of 45 k elements was chosen for all models. This mesh density resulted in an error of less than 2% of the maximum prescribed concentration for all simulations. Additionally, models with this mesh density resulted in less than 5% difference in calculated flow rate compared to a mesh with a 110% increase in density when using a retraction rate of 0.25 mm/min with both the baseline and adjusted constant pressure models. Additionally, a maximum of 0.4% difference was found in Vd between these mesh densities for both constant pressure models. Furthermore, a 1.2% difference in Vd was found when doubling the tissue radius and no appreciable change was found in Vd when increasing the height of the cylindrical surface.
3 |. RESULTS
3.1 |. Model validation
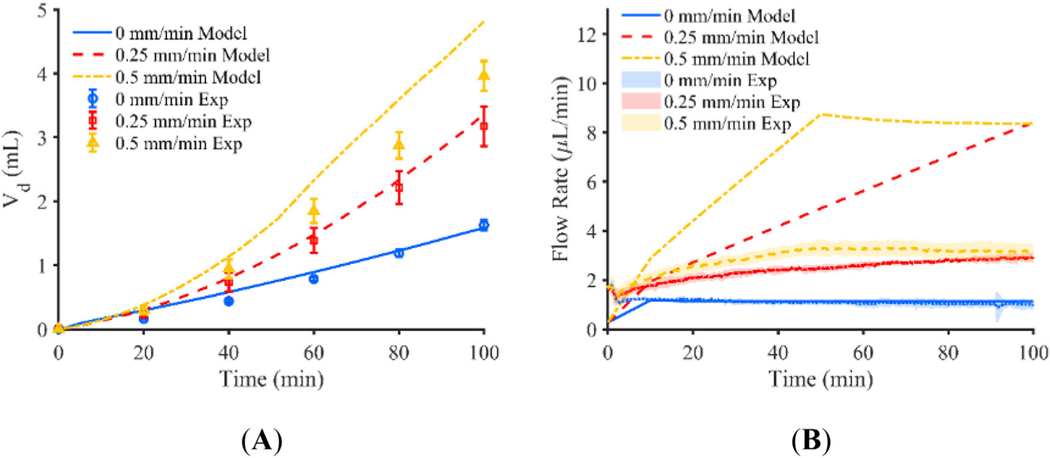
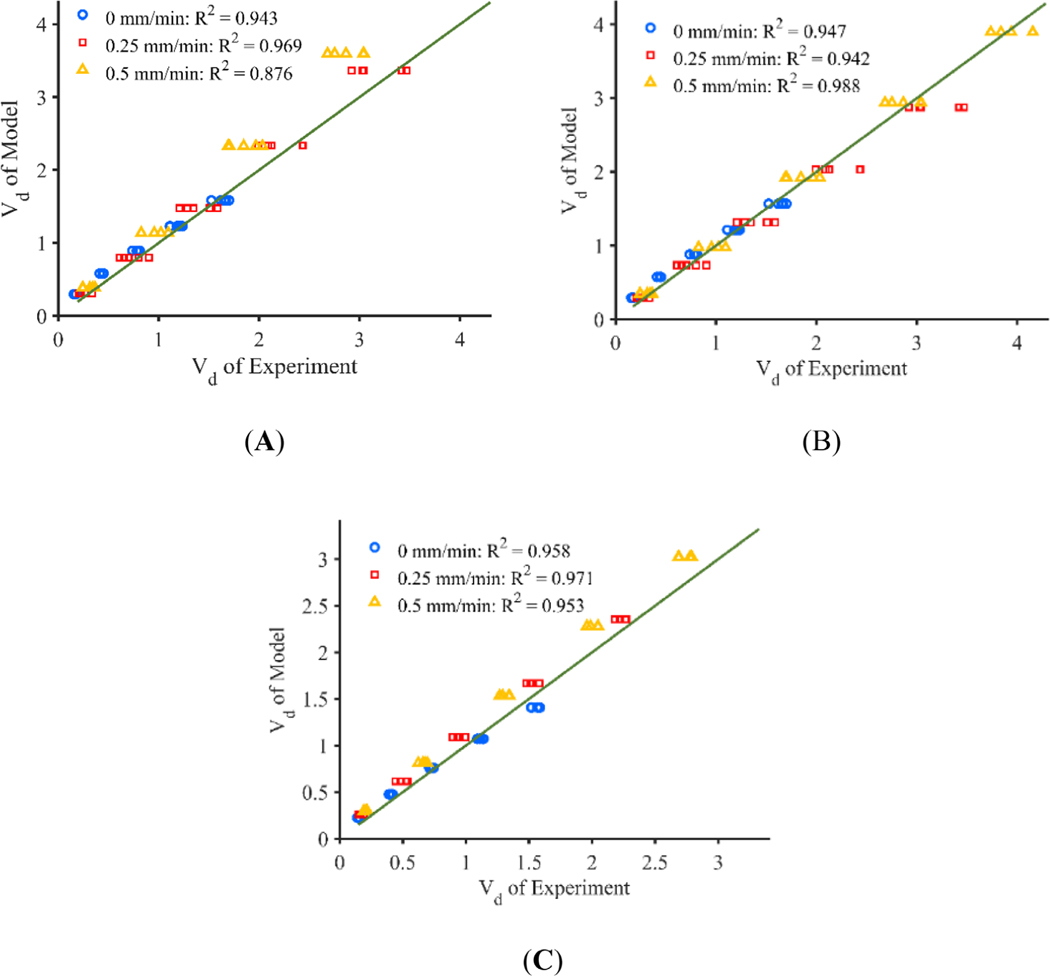
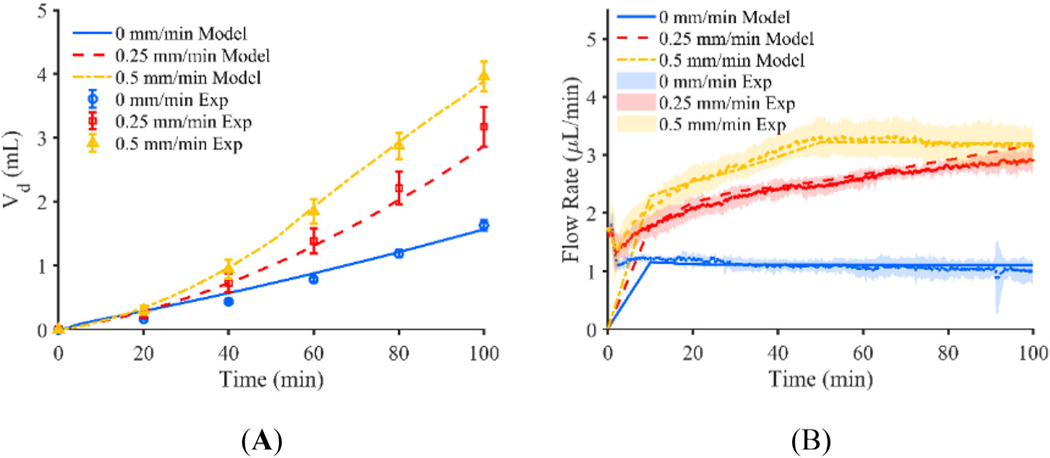
Results from the baseline computational model with no decrease in pressure based on catheter tip position and no shrinking of the infusion cavity is shown in Figure 4. An infusion pressure of 850 Pa was selected parametrically to obtain good agreement with the flow rate of the stationary catheter found in the experiment, given a lack of experimental data for pressure inside of the infusion cavity. Predicted Vd for the stationary and 0.25 mm/min retracting catheter is near the experimental values with a percent difference of 2.9% and 5.9% respectively, but predicted Vd of the 0.5 mm/min catheter is larger than that of the experiment with a percent difference of 21.5%. Further, the flow rate of the 0 mm/min catheter is nearly identical to the flow rate prescribed by the syringe pump in the experiment averaging 1.11 μl/min for both the experiment and the model, but becomes quite different for the 0.25 and 0.5 mm/min catheters with average flow rates of 5.11 and 6.94 μl/min, respectively. These values do not compare similarly to the constant pressure experiments which resulted in average flow rates of 2.41 and 2.90 μl/min for the 0.25 and 0.5 mm/min retraction rates respectively. Figure 6A, shows the Vd of the experiments plotted against the model for each retraction rate with a fit line of .
FIGURE 4.
(A) Vd of constant pressure experiment shown for catheters moving at a rate of 0, 0.25, and 0.5 mm/min plotted with Vd predicted by the respective baseline computational models, and (B) flow rate of constant pressure experiment for catheters moving at a rate of 0, 0.25, and 0.5 mm/min plotted with flow rate predicted by the respective baseline computational models (error bars represent the 95% confidence interval of the experimental results for n = 5 replicates)
FIGURE 6.
Plots of Vd of the model against the experiment at 100 min with a best fit line with a slope of 1 and y-intercept of 0 with catheters moving at a rate of 0, 0.25, and 0.5 mm/min, for the (A) baseline constant pressure, (B) adjusted constant pressure, and (C) constant flow rate models
The adjusted constant pressure computational model used an initial infusion cavity pressure of 850 Pa which was decreased linearly according to the distance from each surface to the needle tip. Pressure started decreasing on surfaces greater than 2 mm away from the needle tip and reached a minimum pressure of 200 Pa at distances larger than 10 mm from the needle tip. Similarly, the infusion cavity radius reduced from 0.18 to 0.09 mm over the same distance. Figure 5 shows the time varying Vd and flow rate predicted by the computational model along with the actual Vd calculated from the agarose gel experiments. The percent difference in Vd between the model and the experiment was 4.0%, 9.5%, and 1.8% for the 0, 0.25, and 0.5 mm/min catheter respectively. The mean flow rates of the 0, 0.25, and 0.5 mm/min catheters more closely resemble that of the experiment with average flow values of 1.11, 2.55, and 2.93 μl/min with the adjusted model. Figure 6B, shows the Vd of the experiments plotted against the model for each retraction rate with a fit line of . Coefficients of determination of greater than 0.9 for all threes movement rates suggest good quantitative agreement between the model and the experiment.
FIGURE 5.
(A) Vd of constant pressure experiment shown for catheters moving at a rate of 0, 0.25, and 0.5 mm/min plotted with Vd predicted by the respective adjusted computational models, and (B) flow rate of constant pressure experiment for catheters moving at a rate of 0, 0.25, and 0.5 mm/min plotted with flow rate predicted by the respective adjusted computational models (error bars represent the 95% confidence interval of the experimental results for n = 5 replicates)
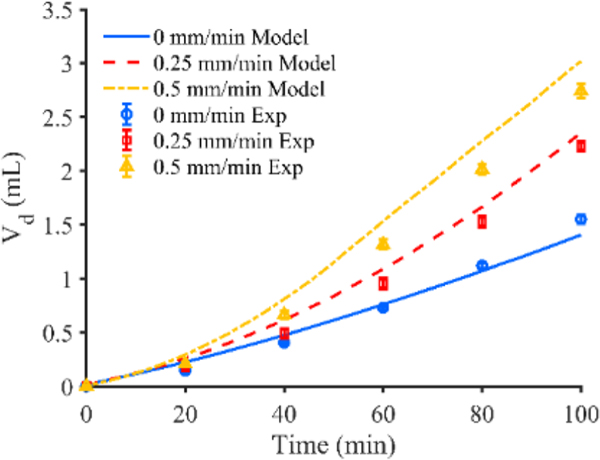
Figure 7 shows the time varying Vd predicted by the constant flow rate computational model along with the actual Vd calculated from the agarose gel experiments. The percent difference in Vd between the constant flow rate model and experiment was 9.3%, 5.5%, and 10.1% for the 0, 0.25, and 0.5 mm/min catheter respectively. The flow rate of the computational model is within 1% of the prescribed flow rate of the experiment for all time points. Figure 6C, shows the Vd of the experiments plotted against the model for each retraction rate with a fit line of . Coefficients of determination of greater than 0.95 for all movement rates suggest good quantitative agreement between the model and the experiment. Finally, the infusion profiles of all three models yielded similar infusion cloud shape when compared to their respective experimental counterparts.27,45
FIGURE 7.
Vd of constant flow rate experiment shown for catheters moving at a rate of 0, 0.25, and 0.5 mm/min plotted with Vd predicted by the respective constant flow rate computational model (error bars represent the 95% confidence interval of the experimental results for n = 5 replicates)
3.2 |. Volume dispersed—Retraction rate
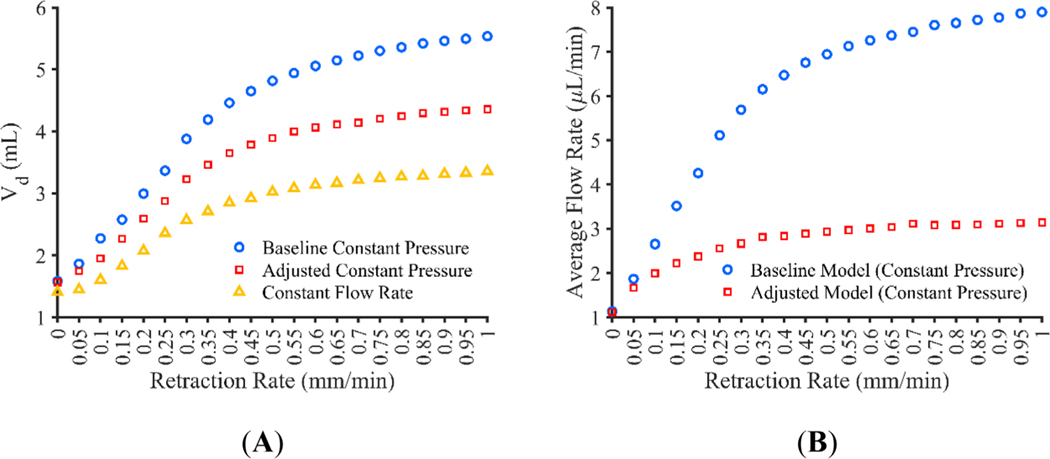
The baseline constant pressure, adjusted constant pressure, and constant flow rate models can be extended to explore retraction rates other than those used in the experiments. Figure 8A shows the Vd for catheter retraction rates of between 0 and 1 mm/min for the baseline constant pressure, adjusted constant pressure, and constant flow rate models. Figure 8B shows the average flow rate achieved for the baseline and adjusted constant pressure models, the constant flow rate model achieved a flow rate within 1.5% of the prescribed 1 μl/min for all retraction rates at all time points. Since maximum retraction distance was limited to 25 mm, the flow rate and Vd do not continue to increase in large amounts at higher retraction rates. Vd appears to increase the most between the 0 and 0.3 mm/min catheters for the constant pressure models and between 0.05 and 0.25 mm/min catheters for the constant flow rate model with at least 10% change in Vd between successive retraction rates.
FIGURE 8.
Computational model results for catheter movement rates ranging from 0 to 1 mm/min showing the (A) volume dispersed (Vd) at 100 min for all three models and (B) average flow rate for the constant pressure models
3.3 |. Volume dispersed—Movement distance
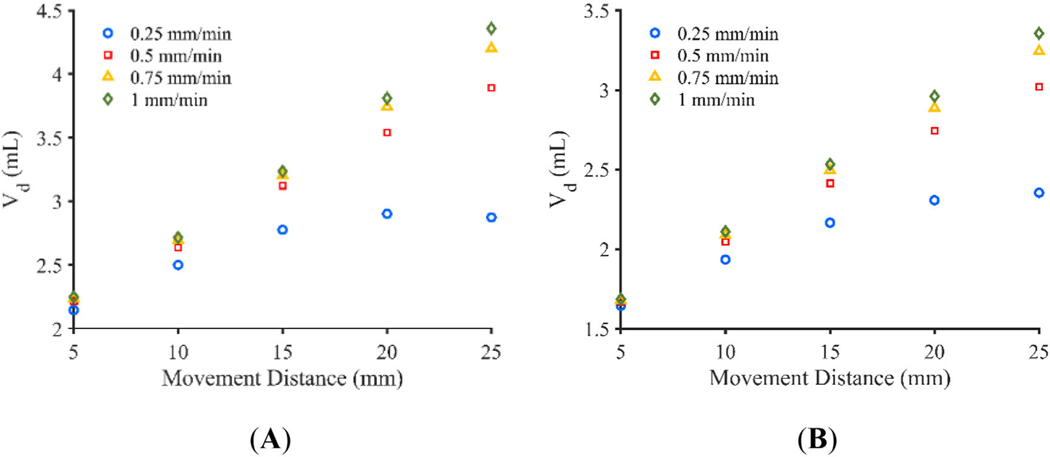
The total movement distance was varied between 5 and 25 mm in 5 mm increments for the 0.25, 0.5, 0.75, and 1 mm/min catheters using both the adjusted constant pressure and the constant flow rate models. Figure 9A,B show the total Vd calculated after 100-min infusions with the various movement distances and retraction rates. At shorter movement distances, retraction rate has a small impact on total Vd, with the impact increasing with increasing movement distance. Further, the movement distance that allows continuous movement throughout the infusion appears to have little advantage over a movement distance that would cause a brief stop in retraction at the end of the infusion. This is especially the case in the constant pressure infusion with a movement distance of 25 mm and retraction rate of 0.25 mm/min which results in a 1% decrease in Vd compared to the 20 mm movement distance using the same retraction rate.
FIGURE 9.
Vd at 100 min for total movement distances ranging from 5 to 25 mm for the (A) adjusted constant pressure model and (B) constant flow rate model
3.4 |. Infusion profiles
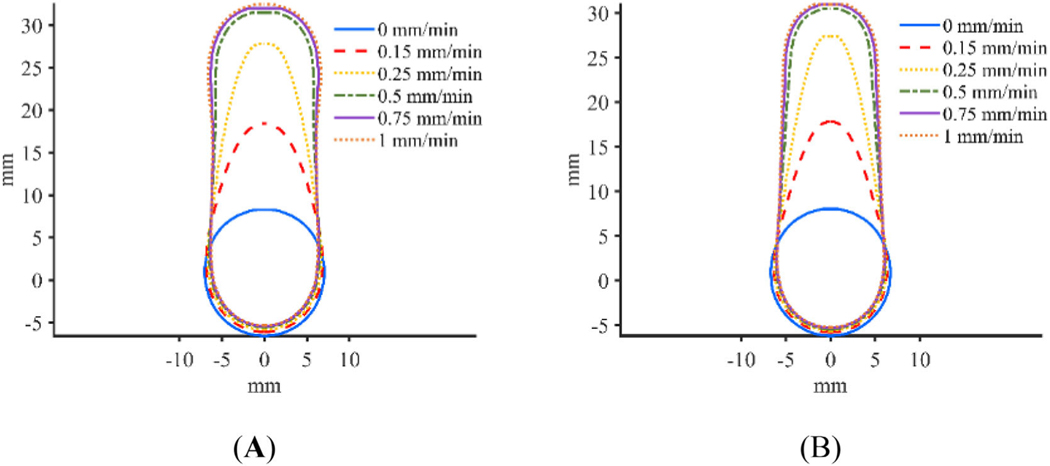
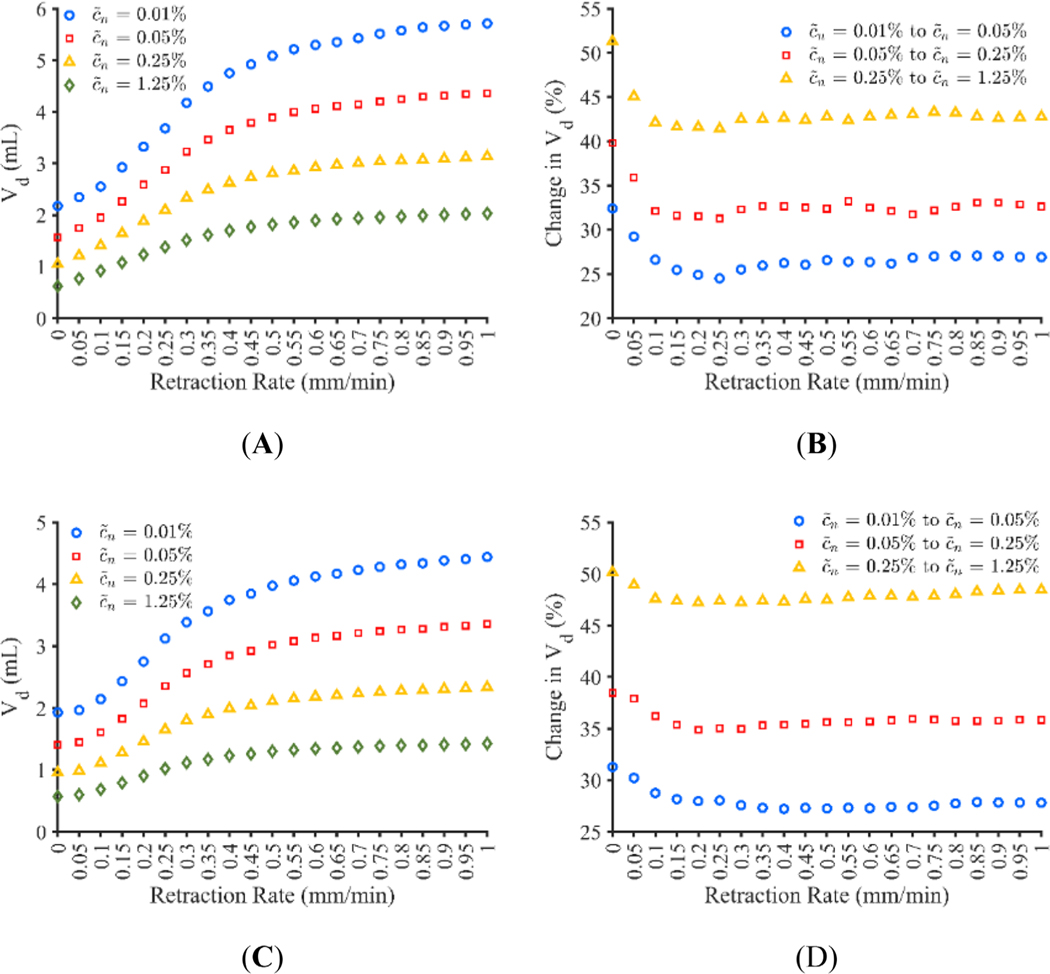
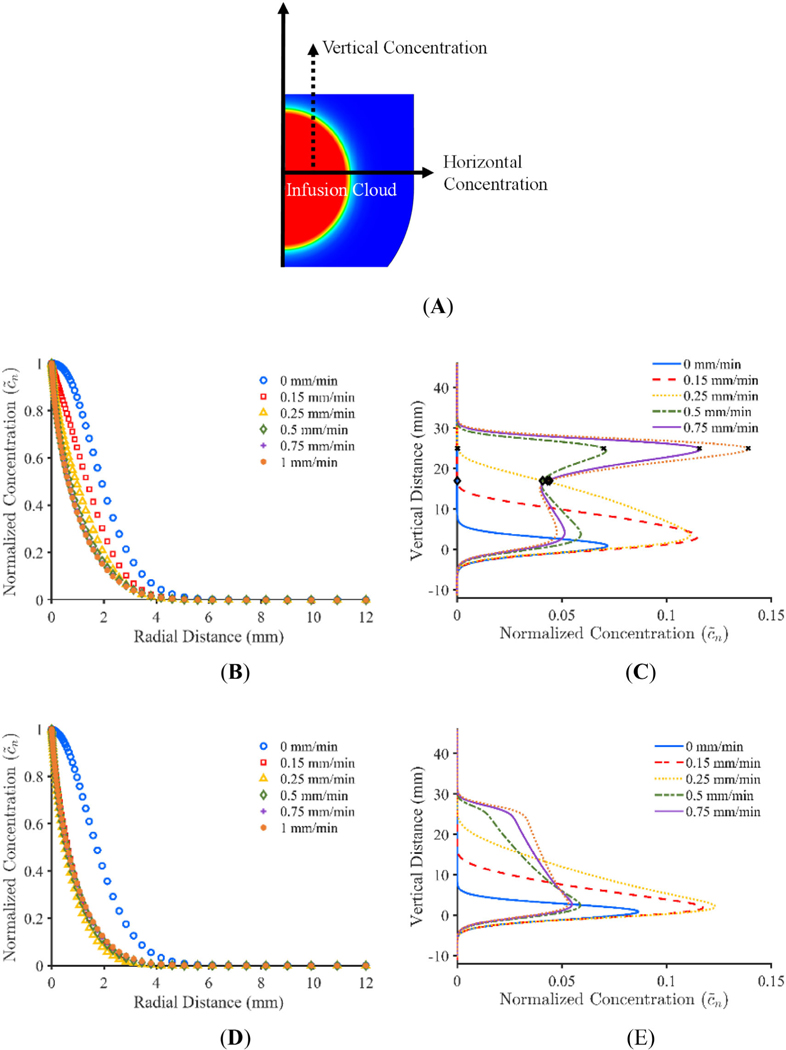
Plots showing the infusion morphology for the adjusted constant pressure and constant flow rate models at a concentration threshold of 0.05% are shown in Figure 10. As seen in Figure 10, retraction rate appears to have an impact on infusion shape. Figure 11A,C show the impact that the variation in concentration profile has on calculated Vd for the adjusted constant pressure and constant flow rate models respectively. Figure 11B,D show the percent change in Vd that occurs for each retraction rate when using successive threshold concentrations for the adjusted constant pressure and constant flow rate models respectively. In order to examine the concentration distribution both radially and vertically, concentration was measured through a standard line, as shown graphically in Figure 12A. The horizontal line was chosen to go through the midpoint of the infusion cloud and the vertical line was chosen to go through the radial midpoint of the cloud in order to capture the reduction in concentration at locations away from the infusion cavity. The concentration distribution along the initial radius of the infusion cloud at 100 min is shown in Figure 12B,D for the adjusted constant pressure and constant flow rate models respectively and the concentration along the vertical axis at half of the 0.05% concentration threshold radius for the respective models is shown in Figure 12C,E.
FIGURE 10.
Infusion profile for various retraction rates with a concentration threshold of 0.05% for (A) adjusted constant pressure, and (B) constant flow rate models
FIGURE 11.
(A and C) Volume dispersed (Vd) after 100-min infusions calculated with different normalized effective concentration threshold levels for catheter retraction rates varying from 0 to 1 mm/min for the adjusted constant pressure model and constant flow rate model respectively, (B and D) percent change in Vd when changing the concentration threshold for the adjusted constant pressure model and constant flow rate model respectively
FIGURE 12.
(A) Schematic showing radial line for horizontal concentration and vertical concentration at the radial midpoint of the infusion cloud, (B and D) radial concentration plot for adjusted constant pressure model and constant flow rate model respectively, (C and E) vertical concentration plot for adjusted constant pressure model and constant flow rate model respectively (× represents where the infusion cavity and pressure begins to decrease and ♢ represents where the infusion cavity and pressure reaches its minimum)
4 |. DISCUSSION
The baseline computational model resulted in the largest Vd and flow rates with catheter retraction rate, where flow rate increased linearly until the catheter stopped moving at a distance of 25 mm. While advantageous, this model does not appear to capture the true conditions inside of the cavity during catheter retraction. Once the catheter begins to move, it is likely that the infusion cavity will reduce in size since the needle is no longer in position to force the cavity open. Additionally, it is unlikely that pressure will be uniform through the entire cavity as the pressure source is located at the proximal end of the cavity, where the catheter tip is located. Given this, it follows that pressure would decrease along the cavity length similar to flow through a cylinder, but because of the short cavity length, this pressure loss may be negligible. What is more likely a significant loss in pressure is the loss of infusate through the porous media as the infusate travels down the cavity, resulting is a similar issue, albeit less exaggerated, issue found by Raghavan et al. where fluid flows primarily through the proximal port in multiport catheters.46 Nonetheless, this model suggests the possibility of great increases in Vd with pressure driven flow if uniform pressure and cavity size can be ensured. A possible method of retaining cavity size while increasing the surface are over which infusion can occur is the use of multiport catheters which contain multiple openings for infusion along length of the catheter. While these catheters preferentially infuse through the most proximal opening, modifications can be made to reduce this occurrence.46 One example is the hollow-fiber catheter which utilizes much smaller ports thereby increasing the resistance to flow and allowing a more uniform infusion from all of the ports.47 While this method showed a nearly 3-fold increase in Vd, the experiments were limited to a very low flow rate of 0.1 μl/min.47 The addition of multiple small ports along the catheter, appears to not only increase surface area for CED, but also likely decreases infusion pressure due to this increase in surface area, a finding which could further benefit from constant pressure infusions. Similarly, the use of controlled reflux, proposed by Lewis et al.25 works under a similar principle to the multiport and controlled catheter movement protocols where an increase in infusion surface area results in an increase in Vd; and therefore, may not only benefit from constant pressure infusions but may be advantageous due to its ability to keep the cavity open throughout the entire infusion.
Both the baseline and the adjusted constant pressure models show the largest increase in Vd occurring between the 0 and 0.3 mm/min retraction rates while the constant flow rate model was more sensitive to movement rate with the highest increase occurring between 0.05 and 0.25 mm/min retraction rates. Additionally, retraction rates that cause the catheter to stop moving before the end of an infusion result in an increasingly marginal gain in Vd. What is more, it is clear from the experiments that some interaction between the catheter and the infusion cavity is taking place, so increasing retraction rates may result in even less gain in Vd than predicted here; however, further experimentation is required.
Variation in total movement distance reveals a less sensitive Vd response to retraction rate with lower movements and an increase in sensitivity with larger movements. Interestingly, it appears that using a retraction rate that would result in a brief period of catheter pause at the end of the infusion may have a small Vd advantage compared to moving the catheter throughout the infusion. Stopping the infusion at the same time that retraction is stopped may not allow for sufficient time for the most proximal surfaces to result in appreciable radial infusion, resulting in less than desired infusion volumes. This phenomenon also explains why the 0.3 and 0.35 mm/min retraction rates appear to be part of the mostly linear region in the plots shown in Figure 8.
While all retraction rates result in rapid infusate concentration decay away from the infusion cavity, the stationary catheter appears to have the quickest decay. On closer inspection, this result is due to the quicker attenuation in concentration along the vertical axis. Given this, the stationary catheter is less robust to variations in minimum concentration requirements. A similar bias toward lower concentrations appears to be seen in infusions of the contrast agent iohexol in ex vivo porcine brains, where nearly 40% of voxels had a concentration between 10% and 15%.48 This is further supported by the “square” curves typically used to describe the concentration gradient of CED infusions.46,49 On the other hand, any catheter movement is more robust in this regard and does not appear to experience as significant of a change in Vd when concentration threshold is changed, due to a larger variation in concentration.
The choice of retraction rate also appears to have an impact on the final shape or morphology of the infusion. The stationary catheter results in a nearly spherical infusion. It should be noted that the stationary infusion protocol did not result in a perfectly spherical shape due to the choice to use a 2 mm long initial infusion cavity, resulting in a mildly elongated infusion shape. Slow to moderate retraction rates result in a teardrop shaped infusion and quick moving catheters, with retraction rates above about 0.5 mm/min, appear to result in mostly cylindrical infusions. Therefore, the choice of retraction rate may depend on the shape of the target area or the type of catheter used. For example, in the CED treatment of Parkinson’s disease, the putamen is generally targeted which has an elongated shape,50 in this case a quick moving catheter may be most advantageous in efficiently covering the entire region of interest. Additionally, the use of a catheter like the arborizing catheter48,51 may benefit most from a moderate retraction rate, such as 0.25 or 0.3 mm/min. In this case, the long tapered infusion shape may be an advantage due to the geometry of the catheter, which results in larger separation distances between adjacent needles at long deployment lengths and smaller separation distances at shorter deployment distances. Therefore, the use of the moderate retraction rate may allow for effective infusion cloud overlap between adjacent needles without causing excessive overlap which could be inefficient.
The flow rates of the retracting catheter in the adjusted model are more similar to that of the experiments, but still exhibit a linear relation between flow rate and time rather than the slightly nonlinear behavior seen in the experiment, suggesting that the model is not fully capturing the interactions in the infusion cavity. While these results still appear promising, we should caution excessive extrapolation of this model as both the degree of cavity shrinking and decrease in cavity pressure that occurred in the experiments are not known but were found parametrically in the computational model. Further refinement of the model should be made in order to allow more explicit modeling of the interaction between the catheter and the tissue and to achieve a more realistic infusion where infusate is pumped into the infusion cavity rather than along the cavity.
In this study, a final infusion cavity diameter of 0.09 mm was found to give the best fit to the experimental data. This results in a stretch ratio of 0.5, previous studies in agarose gel showed a stretch ratio of between 0.708 and 0.763 when inserting needles of varying size into 0.6% agarose gel52 at a rate of 1.8 mm/s. Similarly, a minimum stretch ratio of 0.455 was found with an insertion speed of 0.2 mm/s in a rat brain.53 However, we used an insertion speed of ~13 mm/s in the experiments, and increased insertion speed has been shown to increase radial stress in agarose by 226% when comparing an insertion rate of 1.8 mm/s to a rate of 10 mm/s,54 suggesting that the stretch ratio in our experiments should be significantly less than those previously found in agarose.
The constant flow rate model was able to achieve a flow rate within 1.5% of the prescribed flow rate which is likely better than that found in actual experiments due to noise variables such as tubing compliance that is not often controlled for. This framework allows for further extension of the model to explore the effects of variation of constant flow rates on retraction rate and movement distance. However, the increase of flow rate will result in an increased risk of reflux along the needle tract, potentially impacting total Vd which would also need to be modeled. This can be accomplished in a similar method presented by Orozco et al.43,44
It should also be noted that the model presented here utilizes material properties based on agarose gel and indigo carmine dye in order to validate the model with experimental results conducted in agarose. However, despite its common use as a surrogate to brain tissue,23,25,26,55–59 the homogeneous nature of agarose cannot replicate the true heterogeneous and non-isotropic features of brain tissue including blood vessels and ventricles which are known to distort the dispersal volume shape.60
5 |. CONCLUSION
In this work, we present a computational model which can predict the volume dispersed (Vd) of moving catheters in an agarose gel brain tissue phantom. Results indicate that catheter retraction, regardless of rate results in both larger Vd and in more uniform concentration profiles than stationary catheters. Further work should be conducted to make a model that better matches the physical interactions of the catheter with the tissue and the infusion profile of CED treatment. Furthermore, refinement of the material model of the poroelastic material should be undertaken in order to improve realism of the model and better predict Vd in live tissue. Nonetheless, it appears that catheter retraction at any rate may be advantageous compared to stationary catheters.
Funding information
National Institutes of Health; National Cancer Institute, Grant/Award Number: P01 CA207206-01
DATA AVAILABILITY STATEMENT
The data that support the findings of this study are available from the corresponding author upon reasonable request.
REFERENCES
- 1.Ostrom QT, Cioffi G, Gittleman H, et al. CBTRUS statistical report: primary brain and other central nervous system tumors diagnosed in the United States in 2012–2016. Neuro Oncol. 2019;21((Suppl 5)):v1–v100. [DOI] [PMC free article] [PubMed] [Google Scholar]
- 2.Louis DN, Ohgaki H, Wiestler OD, et al. The 2007 WHO classification of tumours of the central nervous system. Acta Neuropathol. 2007; 114(2):97–109. [DOI] [PMC free article] [PubMed] [Google Scholar]
- 3.Nabors LB, Portnow J, Ahluwalia M, et al. NCCN Clinical Practice Guidelines in Oncology: Central Nervous System Cancers (Version 2.2020); Harborside Press; 2020 [DOI] [PubMed] [Google Scholar]
- 4.Wallner KE, Galicich JH, Krol G, Arbit E, Malkin MG. Patterns of failure following treatment of glioblastoma mulitform and anaplastic astrocytoma. Int J Radiat Oncol Biol Phys. 1989;16:1405–1409. [DOI] [PubMed] [Google Scholar]
- 5.Hochberg FH, Pruitt A. Assumptions in the radiotherapy of glioblastoma. Neurology. 1980;30(9):907–911. [DOI] [PubMed] [Google Scholar]
- 6.Wen PY, Kesary S. Malignant gliomas in adults. N Engl J Med. 2008;359(5):492–507. [DOI] [PubMed] [Google Scholar]
- 7.DeAngelis LM. Brain tumors. N Engl J Med. 2001;344(2):114–123. [DOI] [PubMed] [Google Scholar]
- 8.Pardridge WM. The blood-brain barrier: bottleneck in brain drug development. NeuroRx. 2005;2:3–14. [DOI] [PMC free article] [PubMed] [Google Scholar]
- 9.van Tellingen O, Yetkin-Arik B, de Gooijer MC, Wesseling P, Wurdinger T, de Vries HE. Overcoming the blood-brain tumor barrier for effective glioblastoma treatment. Drug Resist Updat. 2015;19:1–12. doi: 10.1016/j.drup.2015.02.002 [DOI] [PubMed] [Google Scholar]
- 10.Bobo RH, Laske DW, Akbasak A, Morrison PF, Dedrick RL, Oldfield EH. Convection-enhanced delivery of macromolecules in the brain. Proc Natl Acad Sci USA. 1994;91:2076–2080. [DOI] [PMC free article] [PubMed] [Google Scholar]
- 11.Kaiser MG, Parsa AT, Fine RL, Hall JS, Chakrabarti I, Bruce J. Tissue distribution and antitumor activity of topotecan delivered by intracerebral clysis in a rat glioma model. Neurosurgery. 2000;47(6):1391–1399. [PubMed] [Google Scholar]
- 12.Degen JW, Walbridge S, Vortmeyer AO, Oldfield EH, Lonser RR. Safety and efficacy of convection-enhanced delivery of gemcitabine or carboplatin in a malignant glioma model in rats. J Neurosurg. 2003;99(5):893–898. [DOI] [PubMed] [Google Scholar]
- 13.Laske DW, Youle RJ, Oldfield EH. Tumor regression with regional distribution of the targeted toxin TF-CRM107 in patients with malignant brain tumors. Nat Med. 1997;3:1362–1368. [DOI] [PubMed] [Google Scholar]
- 14.Rand RW, Kreitman RJ, Patronas N, Varricchio F, Pastan I, Puri RK. Intratumoral administration of recombinant circularly permuted interleukin-4-pseudonomas exotoxin in patients with high-grade glioma. Clin Cancer Res. 2000;6:2157–2165. [PubMed] [Google Scholar]
- 15.Weber FW, Floeth F, Asher A, et al. Local convection enhanced delivery of IL4-Pseudonomas exotoxin (NBI-3001) for treatment of patients with recurrent malignant glioma. Acta Neurochir. 2003;88:93–103. [DOI] [PubMed] [Google Scholar]
- 16.Lidar Z, Mardor Y, Jonas T, et al. Convection-enhanced delivery of paclitaxel for the treatment of recurrent malignant glioma: a phase I/II clinical study. J Neurosurg. 2004;100(3):472–479. [DOI] [PubMed] [Google Scholar]
- 17.Kunwar S, Chang S, Westphal M, et al. Phase III randomized trial of CED of IL13-PE38QQR vs Gliadel wafers for recurrent glioblastoma. Neuro Oncol. 2010;12(8):871–881. doi: 10.1093/neuonc/nop054 [DOI] [PMC free article] [PubMed] [Google Scholar]
- 18.Sampson JH, Archer G, Pedain C, et al. Poor drug distribution as a possible explanation for the results of the PRECISE trial. J Neurosurg. 2010;113(2):301–309. doi: 10.3171/2009.11.JNS091052 [DOI] [PubMed] [Google Scholar]
- 19.Breeze RE, Wells TH, Freed CR. Implantation of fetal tissue for the management of Parkinson’s disease: a technical note. Neurosurgery. 1995;36(5):1044–1048. [DOI] [PubMed] [Google Scholar]
- 20.Marks WJ Jr, Ostrem JL, Verhagen L, et al. Safety and tolerability of intraputaminal delivery of CERE-120 (adeno-associated virus serotype 2–neurturin) to patients with idiopathic Parkinson’s disease: an open-label, phase I trial. Lancet Neurol. 2008;7(5):400–408. [DOI] [PubMed] [Google Scholar]
- 21.Marks WJ Jr, Bartus RT, Siffert J, et al. Gene delivery of AAV2-neurturin for Parkinson’s disease: a double-blind, randomised, controlled trial. Lancet Neurol. 2010;9(12):1164–1172. [DOI] [PubMed] [Google Scholar]
- 22.Bartus RT, Herzog CD, Chu Y, et al. Bioactivity of AAV2-neurturin gene therapy (CERE-120): differences between Parkinson’s disease and nonhuman primate brains. Mov Disord. 2011;26(1):27–36. [DOI] [PMC free article] [PubMed] [Google Scholar]
- 23.Sillay K, Hinchman A, Kumbier L, et al. Strategies for the delivery of multiple collinear infusion clouds in convection-enhanced delivery in the treatment of Parkinson’s disease. Stereotact Funct Neurosurg. 2013;91:153–161. doi: 10.1159/000345270 [DOI] [PubMed] [Google Scholar]
- 24.Sudhakar V, Naidoo J, Samaranch L, et al. Infuse-as-you-go convective delivery to enhance coverage of elongated brain targets. J Neurosurg. 2019;1:1–8. [DOI] [PubMed] [Google Scholar]
- 25.Lewis O, Woolley M, Johnson DE, et al. Maximising coverage of brain structures using controlled reflux, convection-enhanced delivery and the recessed step catheter. J Neurosci Methods. 2018;308:337–345. [DOI] [PubMed] [Google Scholar]
- 26.Mehta JN, McRoberts GR, Rylander CG. Controlled catheter movement affects dye dispersal volume in agarose gel brain phantoms. Pharmaceutics. 2020;12(8):753. [DOI] [PMC free article] [PubMed] [Google Scholar]
- 27.Mehta JN. A remotely operable convection-enhanced thermo-therapy catheter system for broad distribution of therapeutics in the brain; Doctor of Philosophy, Dissertation, Texas ScholarWorks, The University of Texas at Austin; 2021 [Google Scholar]
- 28.Mauck RL, Hung CT, Ateshian GA. Modeling of neutral solute transport in a dynamically loaded porous permeable gel: implications for articular cartilage biosynthesis and tissue engineering. J Biomech Eng. 2003;125(5):602–614. [DOI] [PMC free article] [PubMed] [Google Scholar]
- 29.Ateshian GA, Likhitpanichkul M, Hung CT. A mixture theory analysis for passive transport in osmotic loading of cells. J Biomech. 2006; 39(3):464–475. doi: 10.1016/j.jbiomech.2004.12.013 [DOI] [PMC free article] [PubMed] [Google Scholar]
- 30.Ateshian GA, Albro MB, Maas S, Weiss JA. Finite element implementation of mechanochemical phenomena in neutral deformable porous media under finite deformation. J Biomech Eng. 2011;133:81005. doi: 10.1115/1.4004810 [DOI] [PMC free article] [PubMed] [Google Scholar]
- 31.Maas S, Rawlins D, Weiss JA, Ateshian GA. FEBio: Finite Elements for Biomechanics Theory Manual 2018; Version 2.7. University of Utah; 2018. [Google Scholar]
- 32.Elenes EY, Rausch MK, Rylander CG. Parametric study of the design variables of an arborizing catheter on dispersal volume using a biphasic computational model. J Eng Sci Med Diagn Ther. 2019;2(3):031002–1–031002–9. [DOI] [PMC free article] [PubMed] [Google Scholar]
- 33.Lai WM, Mow VC. Drag-induced compression of atricular cartilage during a permeation experiment. Biorehology. 1980;17:111–123. [DOI] [PubMed] [Google Scholar]
- 34.Chen X, Sarntinoranont M. Biphasic finite element model of solute transport for direct infusion into nervous tissue. Ann Biomed Eng. 2007;35(12):2145–2158. doi: 10.1007/s10439-007-9371-1 [DOI] [PubMed] [Google Scholar]
- 35.Garcia JJ, Smith JH. A biphasic hyperelastic model for the analysis of fluid and mass transport in brain tissue. Ann Biomed Eng. 2009; 37(2):375–386. doi: 10.1007/s10439-008-9610-0 [DOI] [PubMed] [Google Scholar]
- 36.Smith JH, Garcia JJ. A nonlinear biphasic model of flow-controlled infusion in brain: fluid transport and tissue deformation analyses. J Biomech. 2009;42(13):2017–2025. doi: 10.1016/j.jbiomech.2009.06.014 [DOI] [PubMed] [Google Scholar]
- 37.Smith JH, Garcia JJ. A nonlinear biphasic model of flow-controlled infusions in brain: mass transport analyses. J Biomech. 2011;44(3): 524–531. doi: 10.1016/j.jbiomech.2010.09.010 [DOI] [PubMed] [Google Scholar]
- 38.Smith JH, Starkweather KA, Garcia JJ. Implications of transvascular fluid exchange in nonlinear, biphasic analyses of flow-controlled infusion in brain. Bull Math Biol. 2012;74(4):881–907. doi: 10.1007/s11538-011-9696-7 [DOI] [PubMed] [Google Scholar]
- 39.García JJ, Molano AB, Smith JH. Description and validation of a finite element model of backflow during infusion into a brain tissue phantom. J Comput Nonlinear Dyn. 2013;8(1):011017. [Google Scholar]
- 40.Sobey I, Wirth B. Effect of non-linear permeability in a spherically symmetric model of hydrocephalus. Math Med Biol. 2006;23(4):339–361. [DOI] [PubMed] [Google Scholar]
- 41.Chang P, Wilke C. Some measurements of diffusion in liquids. J Phys Chem. 1955;59(7):592–596. [Google Scholar]
- 42.Reddy K, Doraiswamy L. Estimating liquid diffusivity. Ind Eng Chem Fundam. 1967;6(1):77–79. [Google Scholar]
- 43.Orozco GA, Smith JH, Garcia JJ. Parametric analysis of drug distribution during infusion into the brain using an axisymmetric model with backflow. Rev Ing Biomed. 2014;8(16):56–64. [Google Scholar]
- 44.Orozco GA, Smith JH, Garcia JJ. Backflow length predictions during flow-controlled infusions using a nonlinear biphasic finite element model. Med Biol Eng Comput. 2014;52(10):841–849. doi: 10.1007/s11517-014-1187-1 [DOI] [PubMed] [Google Scholar]
- 45.Mehta J, McRoberts G, Rylander C. Intrainfusion catheter movement facilitates increased infusate volume dispersed in agarose gel. Neuro Oncol. 2020;22:91. [Google Scholar]
- 46.Raghavan R, Brady ML, Rodriguez-Ponce MI, Hartlep A, Pedain C, Sampson JH. Convection-enhanced delivery of therapeutics for brain disease, and its optimization. Neurosurg Focus. 2006;20:E12. doi: 10.3171/foc.2006.20.4.7 [DOI] [PubMed] [Google Scholar]
- 47.Seunguk O, Odland R, Wilson SR, et al. Improved distribution of small molecules and viral vectors in the murine brain using a hollow fiber catheter. J Neurosurg. 2007;107(3):568–577. doi: 10.3171/JNS-07/09/0568 [DOI] [PMC free article] [PubMed] [Google Scholar]
- 48.Elenes EY, Mehta JN, Hsu F-C, et al. Convection-enhanced arborizing catheter system improves local/regional delivery of Infusates versus a single-port catheter in ex vivo porcine brain tissue. J Eng Sci Med Diagn Ther. 2020;4(1):011003. [DOI] [PMC free article] [PubMed] [Google Scholar]
- 49.Lonser RR, Sarntinoranont M, Morrison PF, Oldfield EH. Convection-enhanced delivery to the central nervous system. J Neurosurg. 2015;122(3):697–706. doi: 10.3171/2014.10.JNS14229 [DOI] [PubMed] [Google Scholar]
- 50.Bankiewicz KS, Sudhakar V, Samaranch L, San Sebastian W, Bringas J, Forsayeth J. AAV viral vector delivery to the brain by shapeconforming MR-guided infusions. J Control Release. 2016;240:434–442. [DOI] [PubMed] [Google Scholar]
- 51.Elenes EY. An Arborizing, Multiport Catheter for Maximizing Drug Distribution in the Brain via Convection Enhanced Delivery. Dissertation, Texas ScholarWorks, The University of Texas at Austin; 2018 [Google Scholar]
- 52.Casanova F, Carney PR, Sarntinoranont M. Influence of needle insertion speed on backflow for convection-enhanced delivery. J Biomech Eng. 2012;134(4):041006. [DOI] [PMC free article] [PubMed] [Google Scholar]
- 53.Casanova F, Carney PR, Sarntinoranont M. Effect of needle insertion speed on tissue injury, stress, and backflow distribution for convection-enhanced delivery in the rat brain. PLoS One. 2014;9(4):e94919. [DOI] [PMC free article] [PubMed] [Google Scholar]
- 54.Urrea FA, Casanova F, Orozco GA, García JJ. Evaluation of the friction coefficient, the radial stress, and the damage work during needle insertions into agarose gels. J Mech Behav Biomed Mater. 2016;56:98–105. [DOI] [PubMed] [Google Scholar]
- 55.Elenes EY, Rylander CG. Maximizing local access to therapeutic deliveries in glioblastoma. Part II: arborizing catheter for convection-enhanced delivery in tissue phantoms. Glioblastoma; Codon Publications; 2017:359–372. doi: 10.15586/codon.glioblastoma.2017.ch18 [DOI] [PubMed] [Google Scholar]
- 56.Hood RL, Ecker T, Andriani R, Robertson J, Rossmeisl J, Rylander CG. Augmenting convection-enhanced delivery through simultaneous co-delivery of fluids and laser energy with a fiberoptic microneedle device. SPIE BiOS. 2013;8576:85760G. [Google Scholar]
- 57.Krauze MT, Saito R, Noble C, et al. Reflux-free cannula for convection-enhanced high-speed delivery of therapeutic agents. J Neurosurg. 2005;103(5):923–929. doi: 10.3171/jns.2005.103.5.0923 [DOI] [PMC free article] [PubMed] [Google Scholar]
- 58.Gill T, Barua NU, Woolley M, et al. In vitro and in vivo testing of a novel recessed-step catheter for reflux-free convection-enhanced drug delivery to the brain. J Neurosci Meth. 2013;219(1):1–9. doi: 10.1016/j.jneumeth.2013.06.008 [DOI] [PubMed] [Google Scholar]
- 59.Lam MF, Foo SW, Thomas MG, Lind CR. Infusion-line pressure as a real-time monitor of convection-enhanced delivery in pre-clinical models. J Neurosci Methods. 2014;221:127–131. doi: 10.1016/j.jneumeth.2013.09.019 [DOI] [PubMed] [Google Scholar]
- 60.Raghavan R, Mikaelian S, Brady M, Chen Z-J. Fluid infusions from catheters into elastic tissue: I. Azimuthally symmetric backflow in homogeneous media. Phys Med Biol. 2009;55:281–304. [DOI] [PubMed] [Google Scholar]
Associated Data
This section collects any data citations, data availability statements, or supplementary materials included in this article.
Data Availability Statement
The data that support the findings of this study are available from the corresponding author upon reasonable request.


