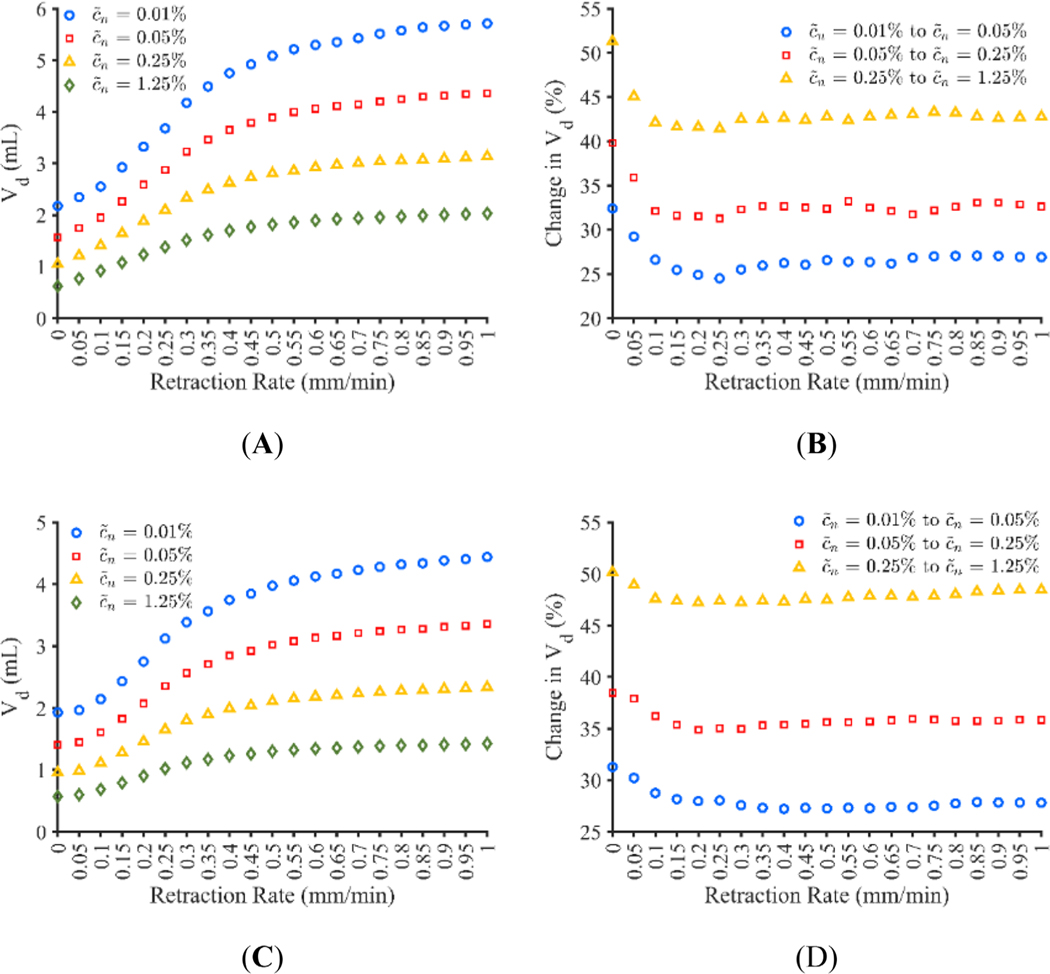
FIGURE 11.
(A and C) Volume dispersed (Vd) after 100-min infusions calculated with different normalized effective concentration threshold levels for catheter retraction rates varying from 0 to 1 mm/min for the adjusted constant pressure model and constant flow rate model respectively, (B and D) percent change in Vd when changing the concentration threshold for the adjusted constant pressure model and constant flow rate model respectively

