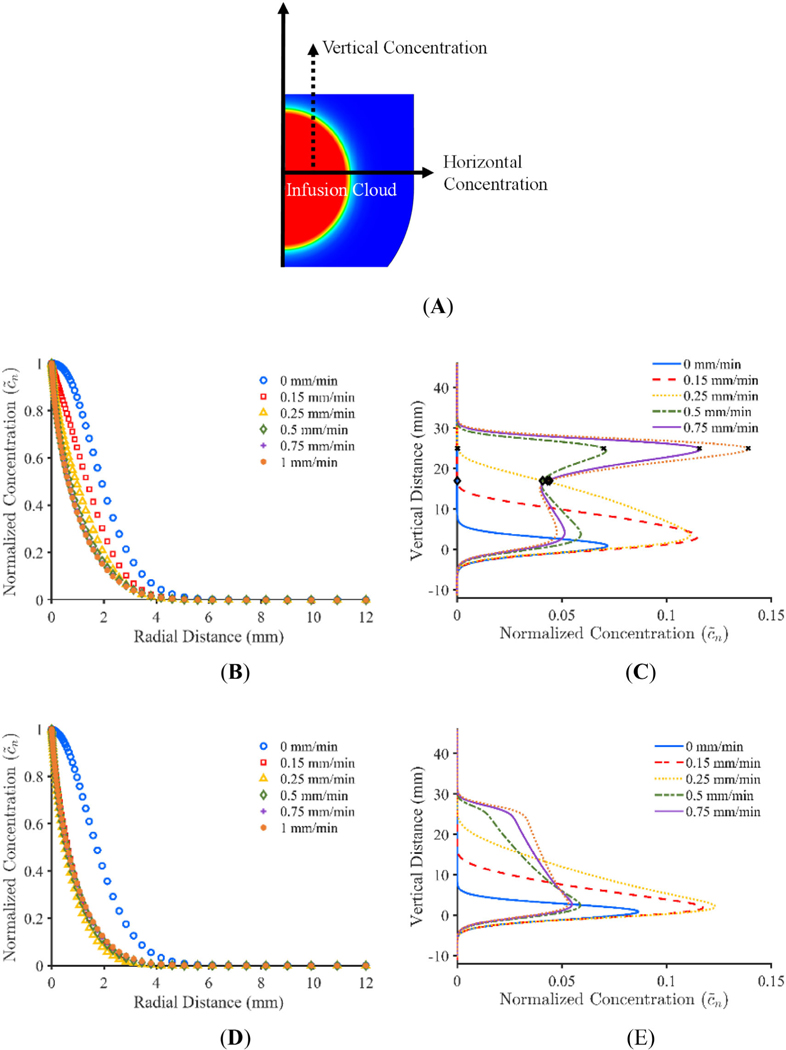
FIGURE 12.
(A) Schematic showing radial line for horizontal concentration and vertical concentration at the radial midpoint of the infusion cloud, (B and D) radial concentration plot for adjusted constant pressure model and constant flow rate model respectively, (C and E) vertical concentration plot for adjusted constant pressure model and constant flow rate model respectively (× represents where the infusion cavity and pressure begins to decrease and ♢ represents where the infusion cavity and pressure reaches its minimum)

