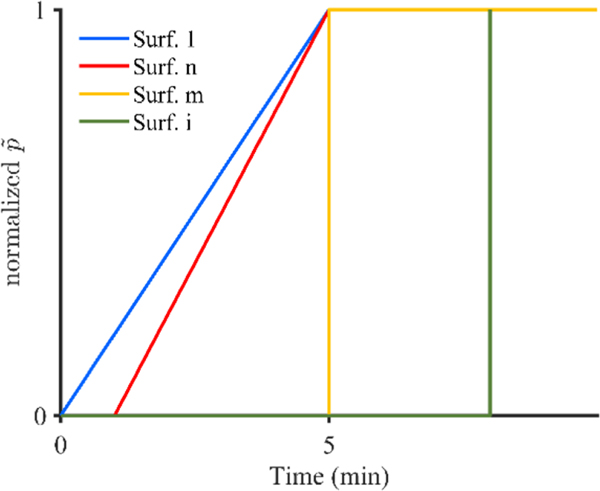
FIGURE 2.
Schematic of pressure application over time, where Surf 1 represents the initial infusion cavity, Surf n represents an arbitrary surface that becomes active within the first 5 min of infusion, Surf m represents a surface that becomes active at 5 min into the infusion, and Surf i represents and arbitrary surface that becomes active after 5 min of infusion

