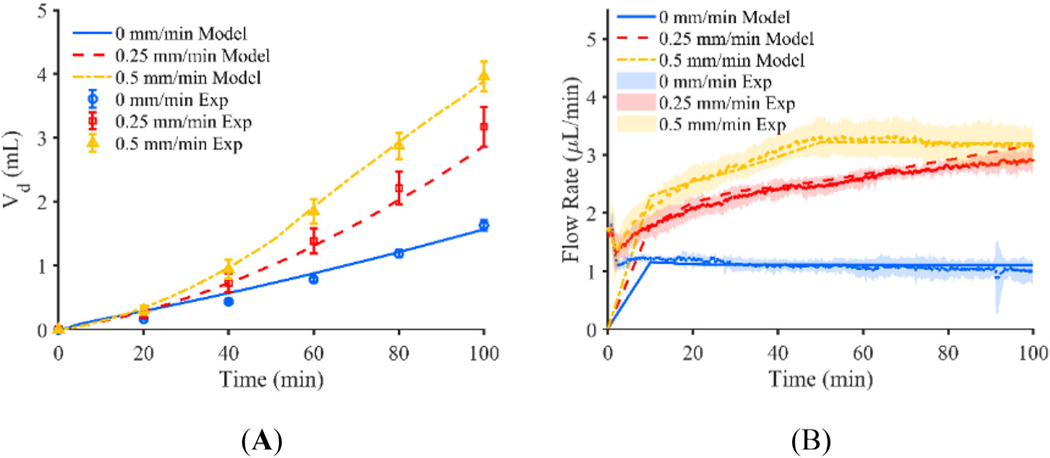
FIGURE 5.
(A) Vd of constant pressure experiment shown for catheters moving at a rate of 0, 0.25, and 0.5 mm/min plotted with Vd predicted by the respective adjusted computational models, and (B) flow rate of constant pressure experiment for catheters moving at a rate of 0, 0.25, and 0.5 mm/min plotted with flow rate predicted by the respective adjusted computational models (error bars represent the 95% confidence interval of the experimental results for n = 5 replicates)

