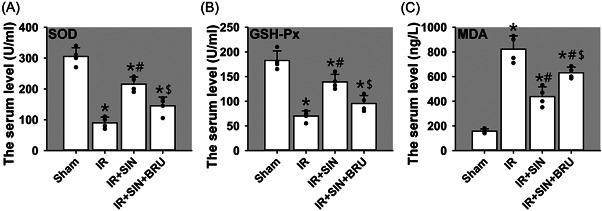
Figure 2.

Roles of SIN in hepatic IR‐induced oxidative stress in rat serum. (A) The activity of SOD. (B) The activity of GSH‐Px. (C) The content of MDA. Bars show means ± SD, n = 4 (the black dots represent the individual data points). * p < .05 versus the sham operation group. # p < .05 versus the IR‐only group. $ p < .05 versus IR + SIN group. GSH‐PX, glutathione peroxidase; IR, ischemia–reperfusion; MDA, malondialdehyde; SOD, superoxide dismutase; SD, standard deviation; SIN, sinomenine
