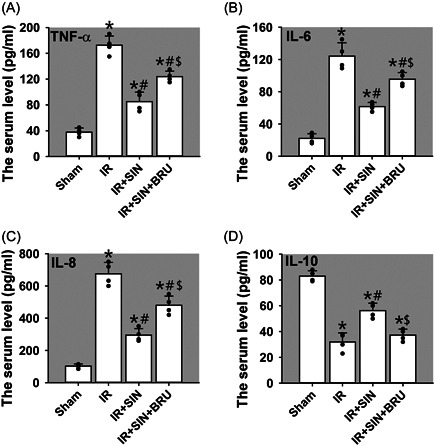
Figure 3.

Roles of SIN in hepatic IR‐induced inflammatory response in rat serum. (A) The content of TNF‐α. (B) The content of IL‐6. (C) The content of IL‐8. (D) The content of IL‐10. Bars represent means ± SD, n = 4 (the black dots represent the individual data points). * p < .05 versus the sham operation group. # p < .05 versus the IR‐only group. $ p < .05 versus the IR + SIN group. IL, interleukin; IR, ischemia–reperfusion; SD, standard deviation; SIN, sinomenine; TNF‐α, tumor necrosis factor‐α
