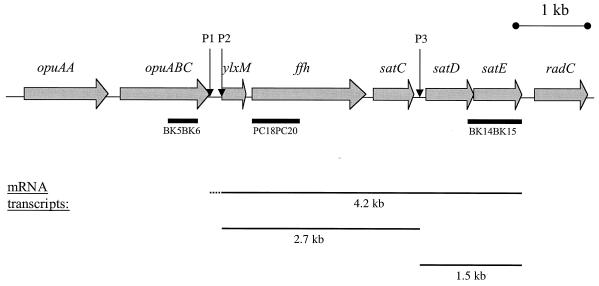
FIG. 1.
Schematic representation of the sat operon locus in S. mutans. The sequences represented here that make up the sat operon were compiled from both our sequencing data (GenBank accession no. U88582) and the genome sequence of strain UAB159 (http://www.genome.ou.edu/smutans.html). Shaded arrows indicate ORFs; their designations are indicated above the sequence. Putative transcription start sites P1, P2, and P3, are indicated. The probes used in Northern blot experiments in this study are shown by bars below the sequence. sat operon mRNAs and their sizes as determined by Northern blot analysis are depicted below the sequence.

