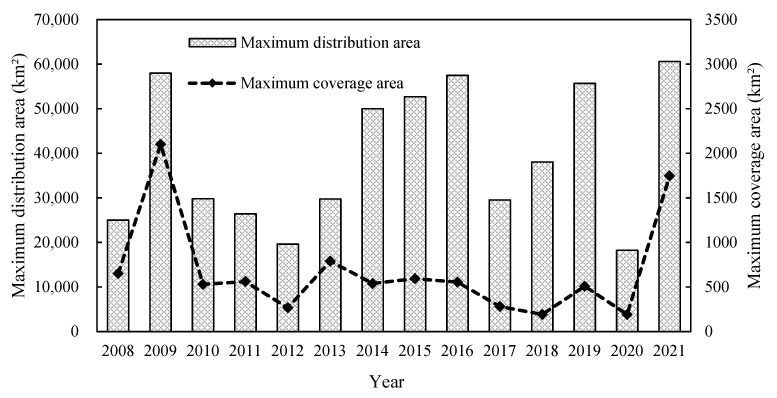
Figure 6.
Maximum daily distribution area (bar graph) and maximum coverage area (dashed line) of Ulva prolifera green tides between 2008 and 2021 (data from The Bulletin of China Marine Disaster: 2009–2021 (MNR, 2009–2021)). Notes: Data based on satellite remote sensing (250 m and 50 m resolution). The distribution area is equal to the sum of the coverage area and the gap between the floating patches.

