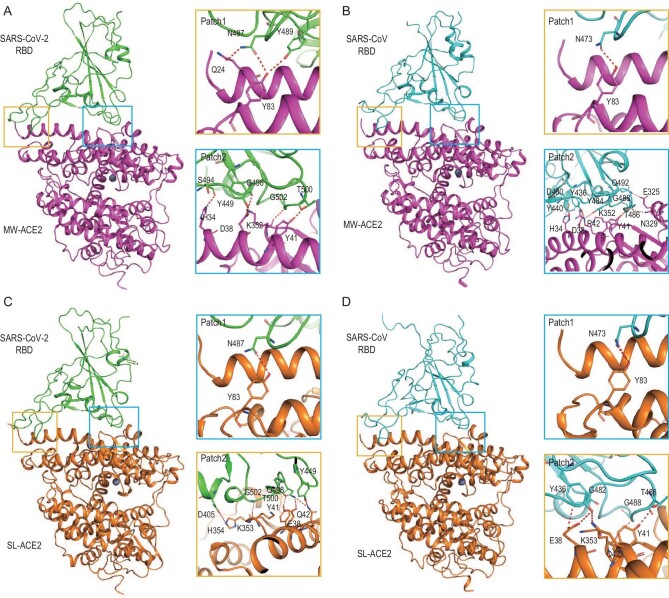
Figure 2.
Overall architectures of the MW-ACE2/SARS-CoV-2 RBD, MW-ACE2/SARS-CoV RBD, SL-ACE2/SARS-CoV-2 RBD and SL-ACE2/SARS-CoV RBD complexes. Overall structure of the (A) MW-ACE2/SARS-CoV-2 RBD, (B) MW-ACE2/SARS-CoV RBD, (C) SL-ACE2/SARS-CoV-2 RBD and (D) SL-ACE2/SARS-CoV RBD complexes. Boxes indicate the interaction patches. The hydrogen bonds network of Patch 1 and Patch 2 are shown. A cartoon representation of the complex structure is shown, and residues participating in hydrogen bond formation are shown as sticks.

