Figure 3.
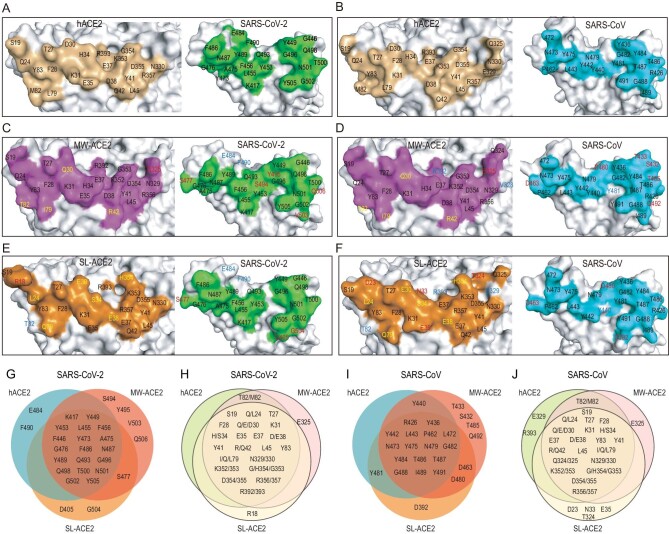
Interface comparison among RBDs of SARS-CoV-2 and SARS-CoV with ACE2 orthologs. Binding interface of (A) hACE2/SARS-CoV-2 RBD, (B) hACE2/SARS-CoV RBD, (C) MW-ACE2/SARS-CoV-2 RBD, (D) MW-ACE2/SARS-CoV RBD, (E) SL-ACE2/SARS-CoV-2 RBD and (F) SL-ACE2/SARS-CoV RBD. Venn diagrams of key residues on (G) SARS-CoV-2 RBD and (I) SARS-CoV RBD that are involved in the interaction with the three ACE2s. Key residues on hACE2, MW-ACE2 and SL-ACE2 participate in the interaction with (H) SARS-CoV-2 RBD and (J) SARS-CoV RBD. In panels C–F, residues in blue indicate that they are only involved in RBD binding by hACE2 but not in the referred ACE2 ortholog. Residues in red indicate that they are only involved in the RBD interaction of the referred ACE2 ortholog but not in hACE2. Residues in yellow indicate that a substitution was observed on the ACE2 interface compared with hACE2.

