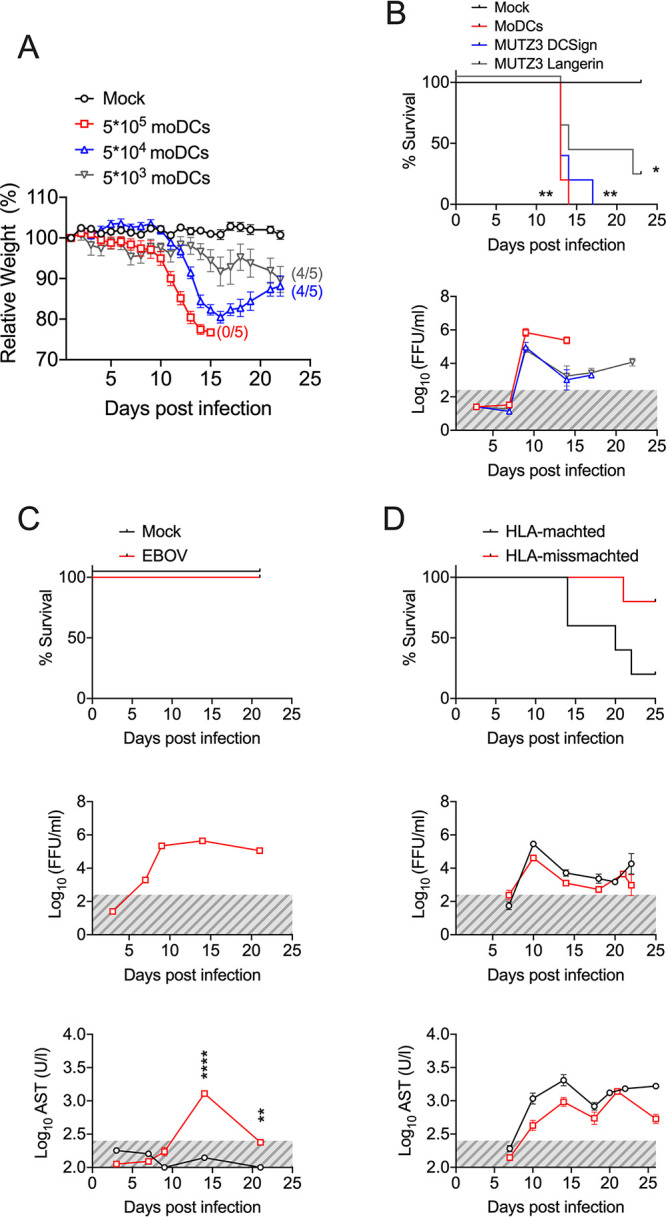
FIG 3.

The onset of EVD in avatar mice depends on T cell-DC interactions. (A) Body weight loss curves of avatar mice transplanted with EBOV-infected DCs at the indicated inputs. Numbers between brackets indicate the number of surviving mice out of n = 5 mice in each group. (B) The Kaplan-Meier survival curves of avatar mice transplanted with infected DCs are as follows. Mock-mice were transplanted with noninfected moDCs, and moDCs indicates monocyte-derived DCs. MUTZ3-DCSign indicates MUTZ-3 cells derived into DC populations enriched in interstitial DC-Sign-like DCs. MUTZ3-Langerin indicates MUTZ-3 cells derived into DC populations enriched in Langerhans-like cells. The bottom panel indicates viremia, as assessed via focus forming assay at the indicated time points. This experiment was done once with n = 5 mice/group. (C) Avatar mice were transplanted with EBOV-infected moDCs in the absence of a previous infusion of autologous huPBLs. The Kaplan-Meier survival curves in comparison with the mock are shown in the upper panel, while the viremia and AST serum levels are shown in the lower panels. Gray areas indicate the limit of detection. (D) Avatar mice were generated by the transplantation of huPBLs followed by the transplantation of EBOV-infected moDCs from HLA-matched (HLA-A*02:01) or mismatched donors. Survival curves, viremia and AST levels in serum are shown. Across the figure, significance levels are presented as follows: *, P ≤ 0.05; **, P ≤ 0.01; ***, P ≤ 0.001; and ****, P ≤ 0.0001. The survival curves were assessed via Mantel-Cox. All other analyses were conducted with a two-way ANOVA followed by Dunnett’s multiple comparison test. Data are shown as mean ± SEM.
