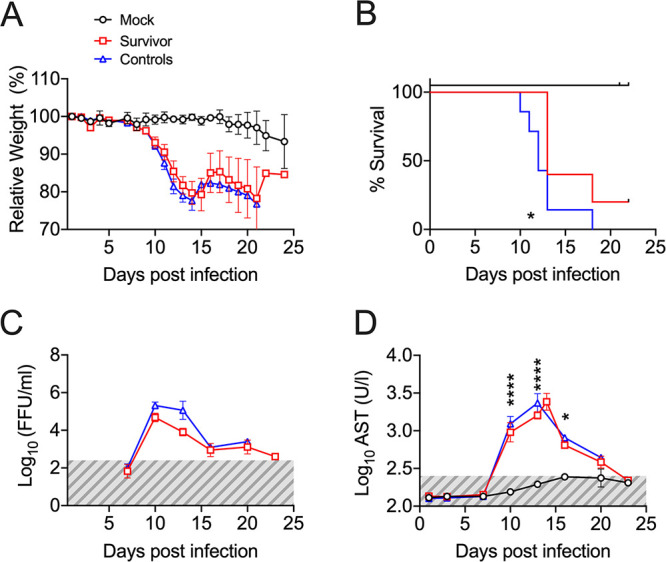
FIG 5.

EVD in avatar mice transplanted with survivor huPBLs. (A) Body weight loss curves of avatar mice transplanted with control huPBLs plus noninfected autologous moDCs (Mock, black), control huPBLs plus HLA-matched EBOV-infected moDCs (Controls, blue), or EVD survivor huPBLs plus HLA-matched EBOV-infected moDCs (Survivors, red). (B) Kaplan-Meier curves. (C) Levels of viremia at the indicated time points in survivor-avatars (red) and control-avatars (blue). The gray area indicates the assay limit of detection. (D) Levels of serum AST in survivor-avatars (red) and control-avatars (blue) at the indicated time points. Across the figure, significance levels are presented as follows: *, P ≤ 0.05; **, P ≤ 0.01; ***, P ≤ 0.001; and ****, P ≤ 0.0001. The survival curves were assessed via Mantel-Cox, and all other analyses were conducted with a two-way ANOVA followed by Dunnett’s multiple comparison test. Data are shown as mean ± SEM.
