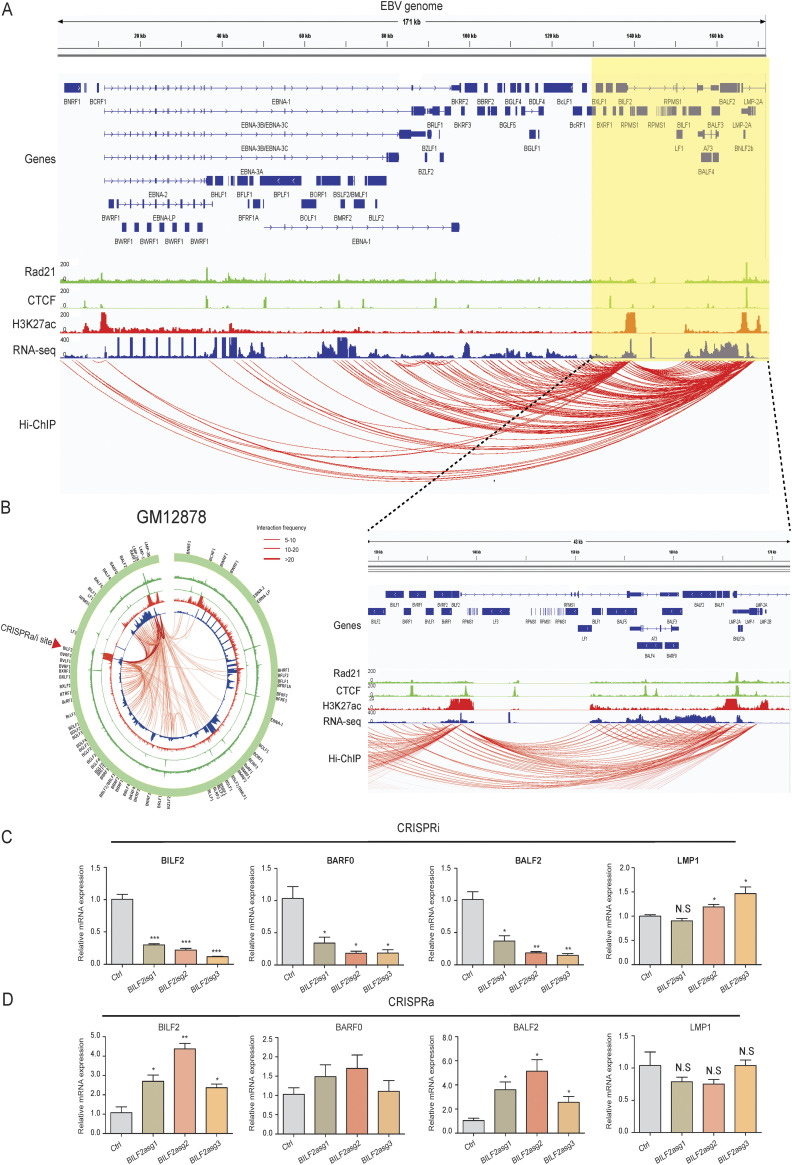
FIG 1.
H3K27ac HiChIP interactions within the Epstein-Barr virus (EBV) genome in type III EBV latency cells. (A) GM12878 LCL H3K27ac HiChIP data were mapped to the EBV genome and visualized in IGV. DNA interactions are indicated by red arcs. ENCODE RAD21 (green, outside), CTCF (green, inside), H3K27ac ChIP-seq (red), and RNA-seq (blue) data were also mapped to the EBV genome and visualized in IGV. EBV annotation is shown on the top. The zoomed-in view on the right side of the EBV genome is shown under the main figure. (B) EBV episome is shown in circos plot. Red arrow indicates position of single guide RNA (sgRNA) for CRISPR interference (CRISPRi) or activation (CRISPRa). Normalized interaction frequency scale is shown on the top right. (C and D) GM12878 lymphoblastoid cell lines (LCLs) stably expressing (C) dCAS9-KRAB-MeCP2 or (D) dCAS9-VP64 were transduced with sgRNA expressing lentiviruses targeting BILF2 enhancer. After puromycin selection, total RNA was purified. Reverse transcriptase quantitative PCR (RT-qPCR) was used to evaluate the expression of BILF2, BALF2, and LMP1. Expression levels of non-targeting sgRNA-transduced cells were set at 1. *, P < 0.05; **, P < 0.01; ***, P < 0.001; NS, not significant.

