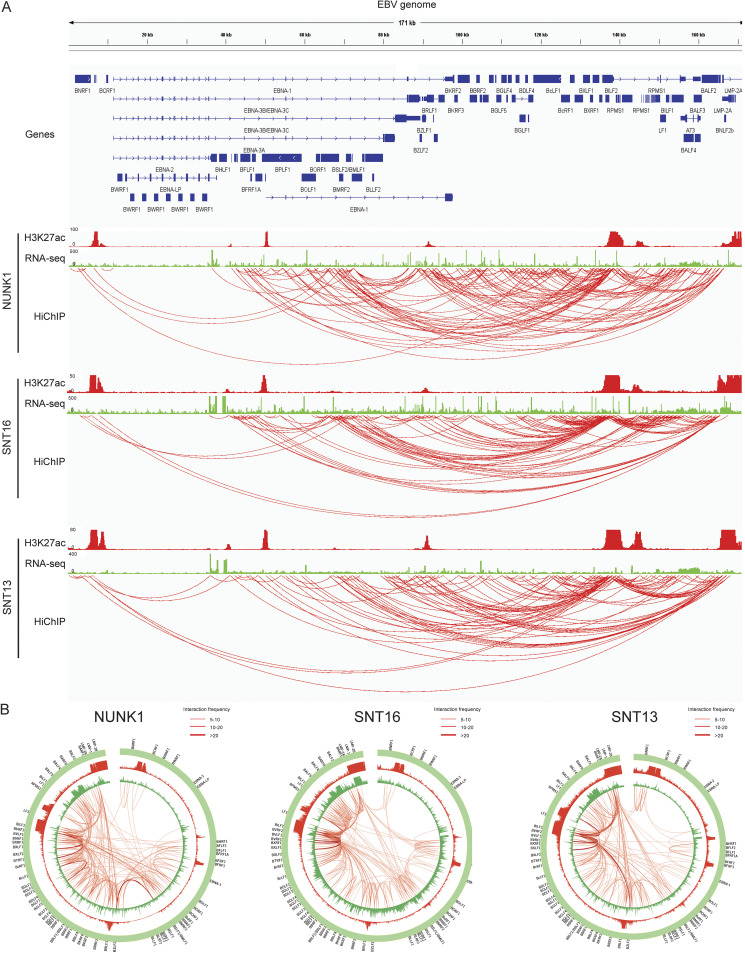
FIG 3.
H3K27ac HiChIP interactions within the EBV genome in type II EBV latency cells NUNK, SNT13, and SNT16. (A) EBV T/NK cell lymphoma NUNK1, SNT13, and SNT16 H3K27ac HiChIP data were mapped to the EBV genome and visualized in IGV. DNA interactions are indicated by red arcs. H3K27ac ChIP-seq and RNA-seq data were also mapped to the EBV genome and visualized in IGV. EBV annotation is shown on the top. (B) EBV episome is shown in circos plot. Normalized interaction frequency scale is shown on the top right.

