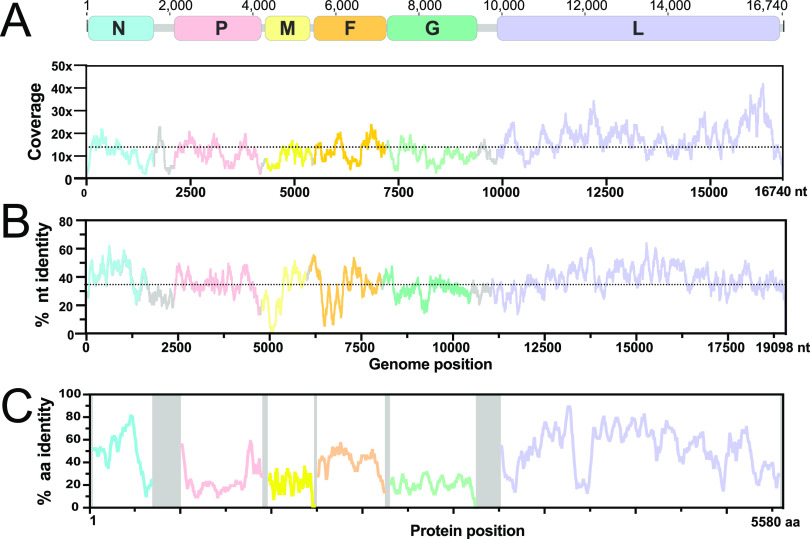
FIG 2.
AngV genome organization. (A) Coding regions for each gene are shown and depicted in color; noncoding intergenic and terminal regions are highlighted in gray. Depicted genes represented as follows: nucleocapsid (N), phosphoprotein (P), matrix (M), fusion (F), glycoprotein (G), and RNA polymerase (L). Sequencing read depth supporting each position of the recovered genome sequence is plotted below the genomic schematic. Scanning nucleotide (B) and amino acid (C) pairwise identity to Nipah virus (GenBank accession number: AF212302). Dotted horizontal lines represent average read depth (14.29) or average nucleotide pairwise identity (36%).

