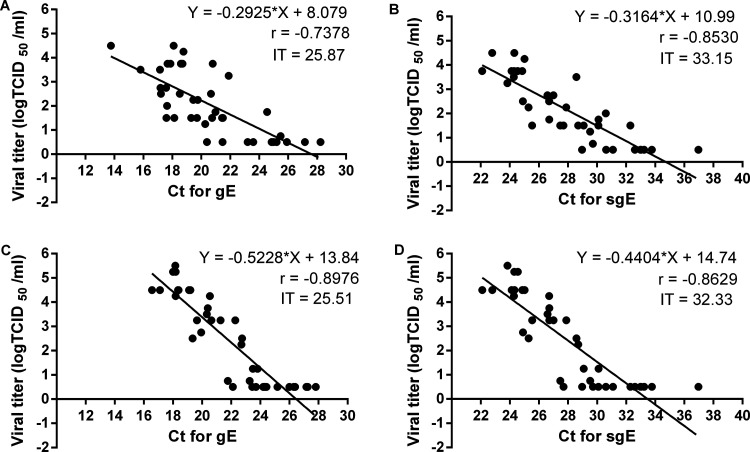
FIG 5.
Infection threshold determination and correlation between gRNA, sgRNA, and viral titers in experimentally infected hamsters. Correlation and linear regression analysis between gRNA and viral titer in nasal washes (A) and oropharyngeal swabs (C). Correlation and linear regression analysis between sgRNA and viral titer in nasal washes (B) and oropharyngeal swabs (D). Infection threshold (IT) is the corresponding CT value in the linear regression equation when viral titer is 0.5 -log TCID50 (50% tissue culture infective dose). Linear regression equations, Pearson correlation coefficients (r), and infection thresholds are included in each panel.

