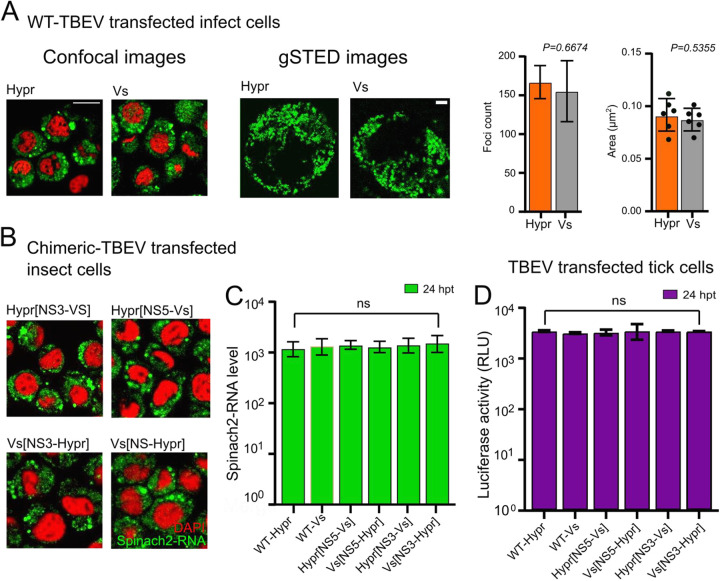
FIG 5.
Replication of WT and NS5/NS3 chimeric replicons in invertebrate cells. (A) Sf9 cells were transfected with SP6 in vitro transcribed Spinach2 tagged (A) WT Hypr, Vs, or (B) chimeric replicons. (A) At 24 hpt, cells were incubated with DFHBI and live cells imaged on a Zeiss LSM780 confocal or Leica TCS SP8 gSTED microscope (upper left panel). Scale bars: 50 μm and 5 μm, respectively. Spatial data for gSTED-imaged Spinach2 RNAs determined using Fiji Image J (≥6 cells). Data were used to determine the Spinach2-RNA foci count per cell and average size per focus for Hypr and Vs (upper right graphs). (B) Spinach fluorescence from cells transfected with the indicated chimeric replicons (green). Cells were costained with DAPI (red). Scale bars: 50 μm. (C) Quantification of WT and chimeric Spinach2 RNA expression using Fiji Image J (≥10 cells for each chimera). (D) Luciferase assays of tick (IRE/CTVM19) cells cotransfected with TBEV replicons (WT or chimeras) at 24 hpt. Bar heights represent the mean ± SEM of three biological replicates. ns, no significant difference from WT Hypr determined using a one-way ANOVA.

