FIG 6.
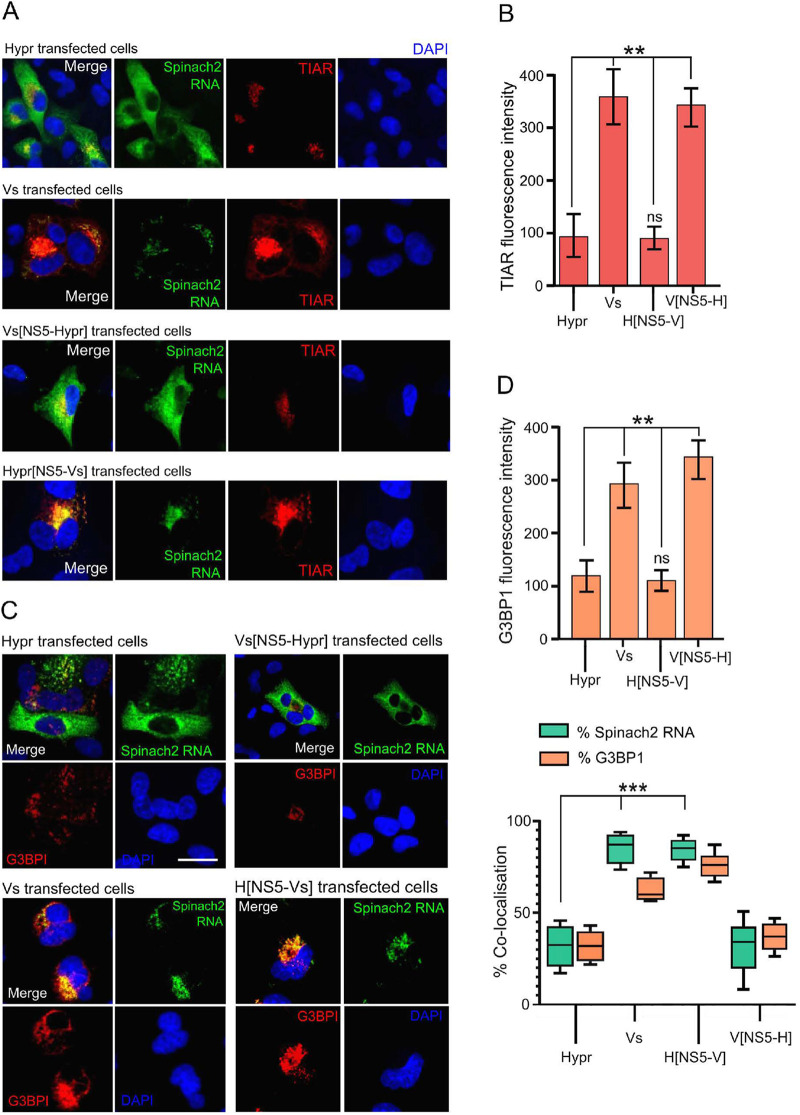
Formation of stress granules in TBEV replicon cells. (A) Replicon (WT or NS5 chimeras) and mock-transfected cells were fixed with 4% PFA at 24 hpt, incubated with DFHBI (Spinch2 signals indicated in green), and stained with anti-TIAR (red) and DAPI (blue). Cells were imaged on a Zeiss LSM780 confocal microscope. (B) Quantification of TIAR levels in WT Hypr- and-Vs or NS5 chimera transfected cells. Bar heights represent the mean ± SEM of two biological replicates. (C) Indicated replicon transfected cells were incubated with DFHBI (Spinch2 signals indicated in green), stained with anti-G3BP1 (red) and DAPI (blue), and imaged on an Airyscan microscope. Scale bar: 20 μm (left panel). (D) Quantification of G3BPI levels in WT Hypr- and Vs- or NS5-chimera transfected cells (upper left graph). Bar heights are the mean ± SEM of two biological replicates. Quantification of the colocalization of Spinach2 RNA with G3BP1 (green) or G3BPI colocalized with Spinach2 RNA (red). Manders’ overlap colocalization coefficients were calculated from ≤ 10 cells using Fiji, from at least two independent experiments (lower left graph). **, P < 0.001; ***, P < 0.0001 from WT Hypr determined using a two-tailed Student's t test with Welch’s correction.

