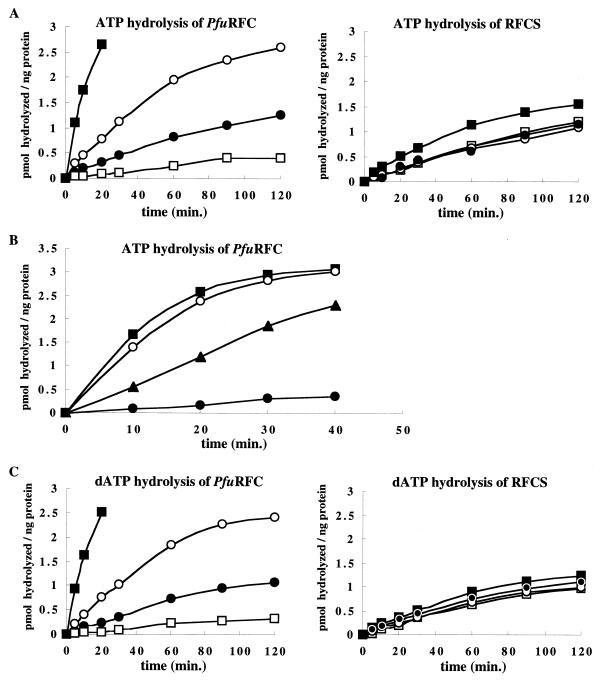
FIG. 4.
ATPase activity of RFCS and PfuRFC. The PfuRFC or RFCS protein (each at 0.3 μg), [α-32P]ATP or [α-32P]dATP (0.05 μCi/μl), and 50 mM ATP or dATP were incubated with or without DNA and PfuPCNA at 65°C for the indicated times. Aliquots of the reactions were analyzed by thin-layer chromatography, and the amounts of hydrolyzed ATP or dATP were quantified from the autoradiogram using a laser excited image analyzer. The graphs show the values after subtraction of the background. (A) Effects of DNA and PfuPCNA on the activity. Symbols: ●, RFC protein only; ○, with ssDNA; □, with PfuPCNA; ■, with ssDNA and PfuPCNA. (B) Dependency of the stimulation on the DNA structure. Symbols: ●, PfuRFC only; ▴, with dsDNA; ○, with ssDNA; ■, with priDNA. (C) dATPase activity of RFCS and PfuRFC. Symbols are as described for panel A.

