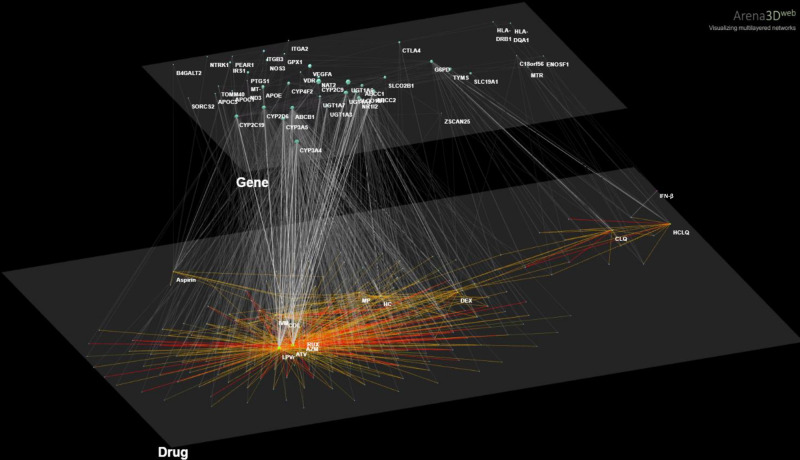
Fig. 2. Arena3Dweb visualization.
A 3D visualization of a 2-layer network shows all the interactions retrieved from all sources described in the computational workflow (Fig. 1). DDIs are shown in the bottom layer with name annotations of COVID-19 treatments as the main nodes, whereas PPI interactions in the top layer with protein names. Drug-pharmacogene genes associations retrieved from PharmGKB are shown between layers.

