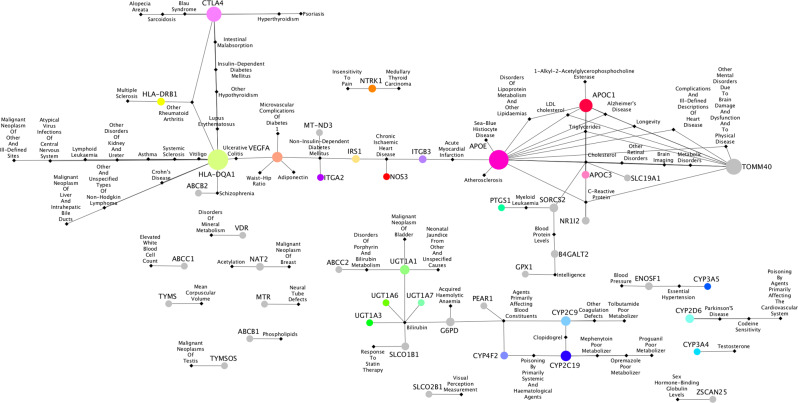
Fig. 3. The gene-disease association network.
Nodes in circles are PGx genes significantly predicted to affect clinical outcomes. Black nodes in rhombus represent the diseases. Edges between a gene and disease show the associations according to GWAS and Kontou et al. predictions. The size of a node indicates the higher connectivity with diseases. The top highly connected nodes with degree greater than 4 are: HLA-DQA1: 16, APOE: 15, TOMM40: 11, CTLA4: 10, APOC1: 8, CYP2C19: 5, VEGFA: 4, CYP2C9: 4. The full list of gene-disease interactions is provided in Supplementary File 3.

