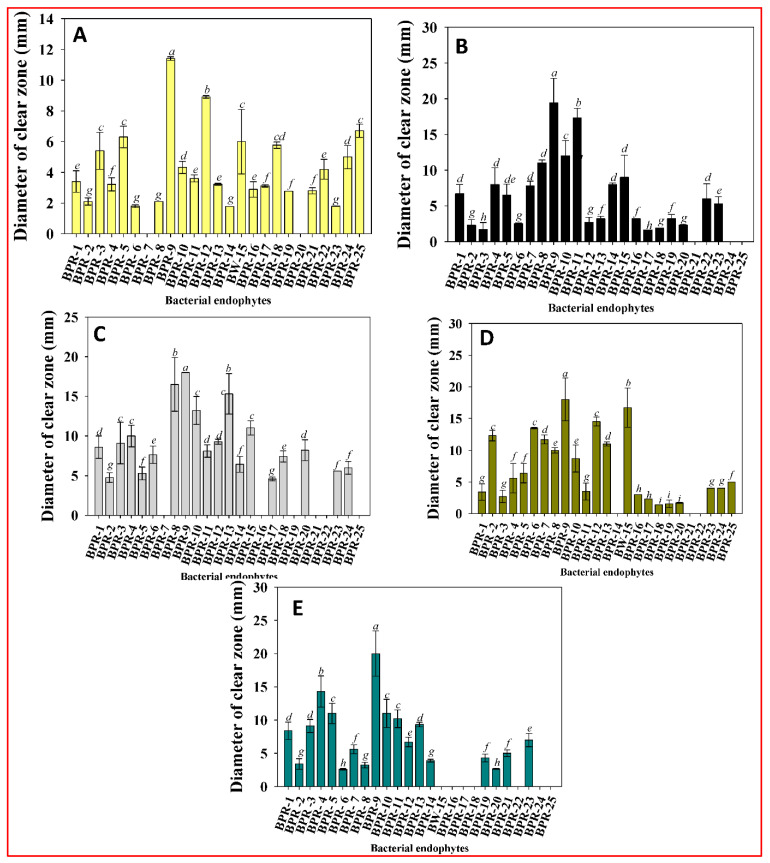
Figure 2.
Clear zones produced as a result of extracellular enzyme activity from bacterial endophytes: (A) protease; (B) cellulase; (C) amylase; (D) lipase; and (E) pectinase. Each bar represents the mean of five replicates (n = 5). Corresponding error bars represents standard deviation (S.D.) of five replicates. Letters a, b, c, d etc. in figure depicts that mean values are significantly different from each other according to Duncan’s multiple range test (DMRT).

