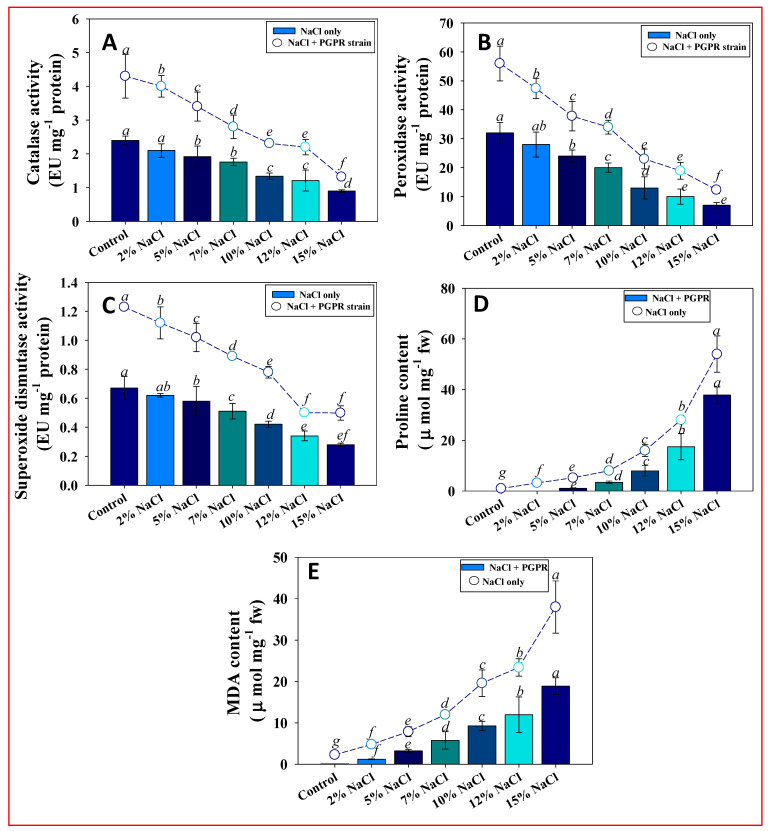
Figure 7.
Antioxidant enzymatic activities (A) CAT, (B) POD, and (C) SOD; and stress biomarkers (D) proline, and (E) MDA in BPR-9 inoculated and NaCl-treated wheat seedlings. Each bar or point represents the mean of five replicates (n = 5). Corresponding error bars represents standard deviation (S.D.) of five replicates. Different lower-case letters represent mean values that are significantly different according to DMRT test.

