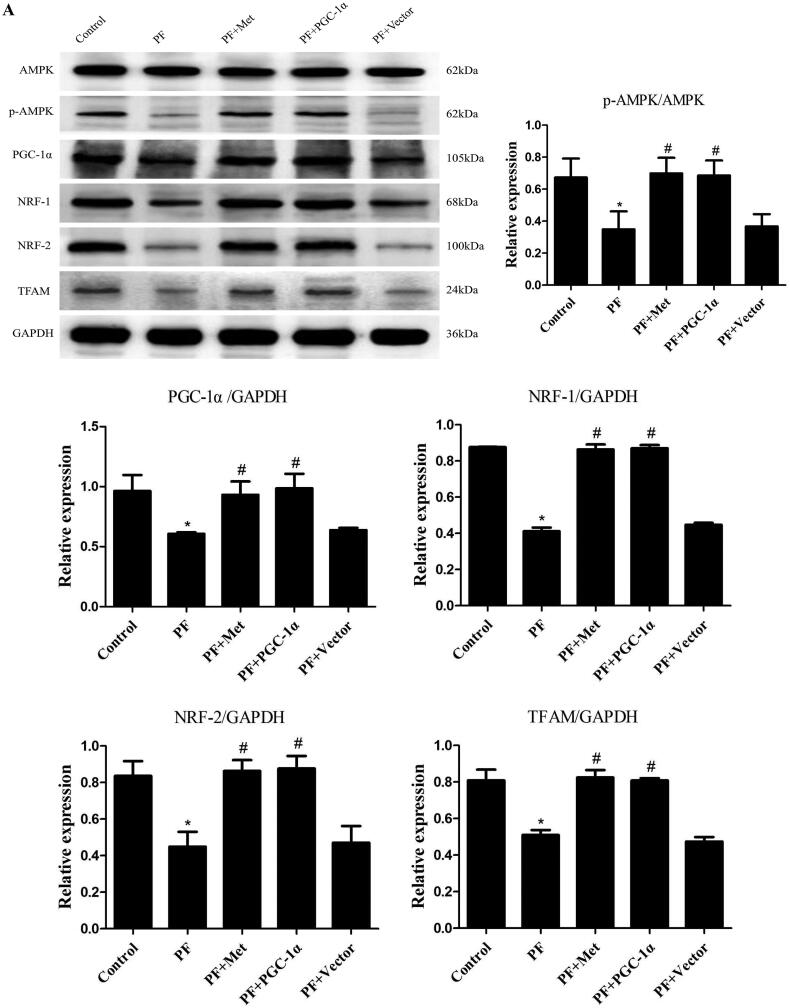
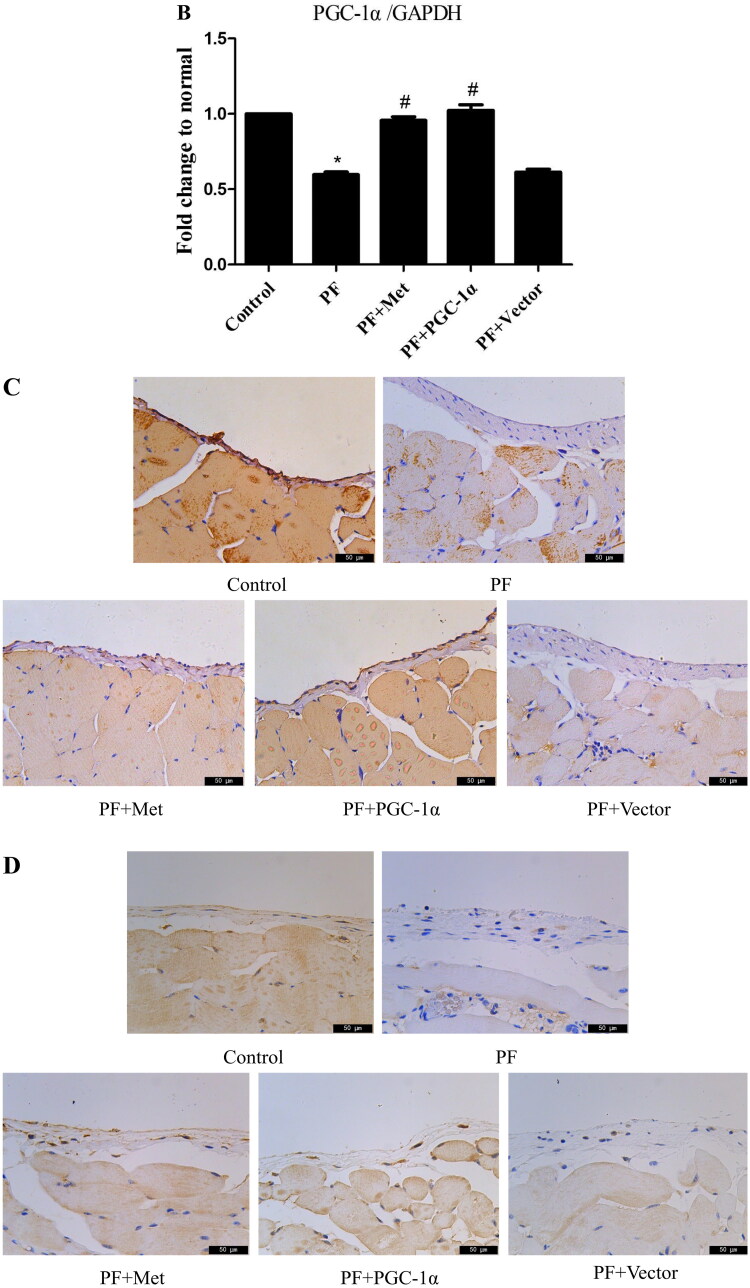
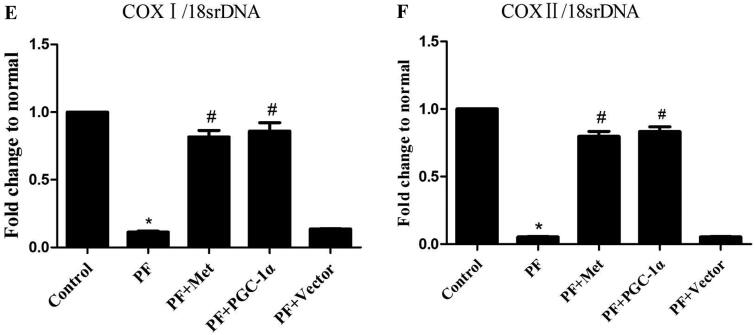
Figure 1.
Reduced mitochondrial biogenesis capacity in a mouse model of PF. A mouse model of PD-induced PF was established. Animals were randomly divided into five groups: the control group, peritoneal fibrosis group (PF), peritoneal fibrosis + metformin group (PF + Met), peritoneal fibrosis + PGC-1α overexpression group (PF + PGC-1α), and peritoneal fibrosis + empty vector group (PF + Vector). (A) Immunoblotting was used to evaluate the expression of p-AMPK, PGC-1α, NRF-1, NRF-2 and TFAM. (B) RT–PCR was used to evaluate the mRNA expression of PGC-1α. (C&D) Immunohistochemistry was used to evaluate NRF-1 and NRF-2 expression (magnification ×400). (E&F) RT–PCR was used to evaluate the mtDNA amount. The ratio of COX I or COX II to 18S rDNA was calculated, indicating the relative mitochondrial copy number. The obtained results are representative of three independent experiments. *p < 0.05 vs. Control. #p < 0.05 vs. PF. PD: peritoneal dialysis; p-AMPK: phospho-adenosine monophosphate-activated protein kinase; PGC-1α: peroxisome proliferator-activated receptor γ coactivator-1α; NRF: nuclear respiratory factor; TFAM: mitochondrial transcription factor A. RT–PCR: real-time polymerase chain reaction; mtDNA: mitochondrial DNA; COX: cytochrome c oxidase.


