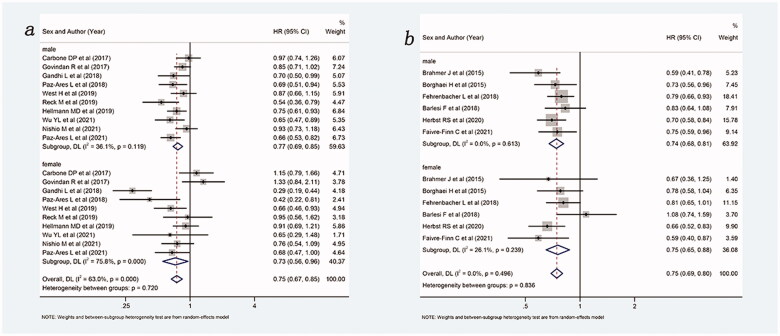
Figure 4.
Forest plot of comparison based on treatment stage. (a) Overall survival of patients receiving ICIs with or without chemotherapy versus patients not receiving ICIs (receiving chemotherapy or placebo only) in first line (male: p < .001, female: p = .023, overall: p < .001). (b) Overall survival of patients receiving ICIs with or without chemotherapy versus patients not receiving ICIs (receiving chemotherapy or placebo only) in non-first line (male: p < .001, female: p < .001, overall: p < .001).

