
Figure 2.
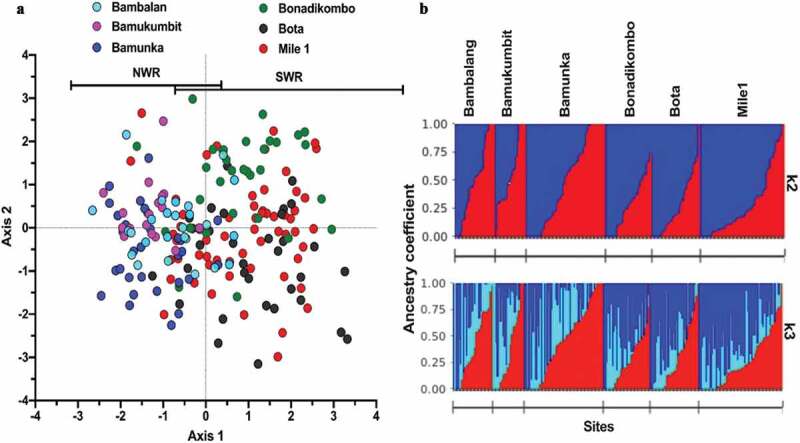
Population structures and Ancestral origin of P. falciparum infections from two contrasting geo-ecological sites of Cameroon. (a) Scatter plot of discriminant analysis of principal components (DAPC) showing genetic clusters of P. falciparum infections (color-coded by collection site within the two regions) from collection sites. (b) Population clustering based on ancestral origin showing ancestry coefficients and optimum k means (k = 2 and k = 3). k = 2 produced two major population clusters (dark blue and red) while k = 3 produced the two major population clusters of microsatellite haplotypes and a common cluster (light blue). Black borders separate individual populations.