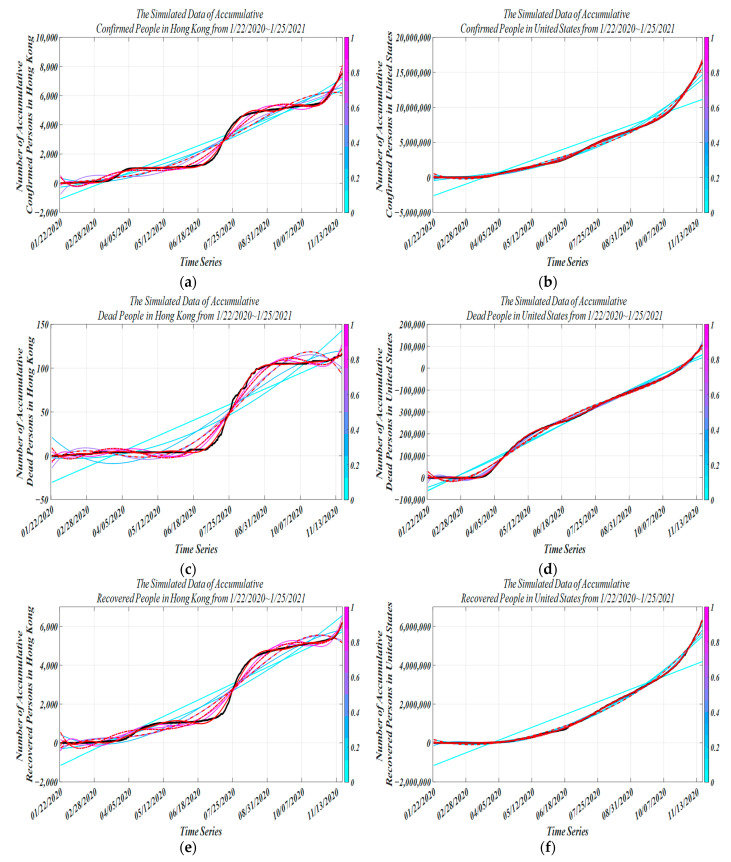
Figure 3.
Simulated data vs. actual data from 22 January 2020 to 25 January 2021 (black curve, actual data of accumulative dead people; other curves, simulated data of accumulative dead people; different color curves, different degrees of fitness; red solid line, our methodology; red dashed line, SIRD-RM model; red dashed line with dots, SEIRDV model) (a) vs. (b) accumulative confirmed people (c) vs. (d) accumulative recovered people (e) vs. (f) accumulative dead people.

