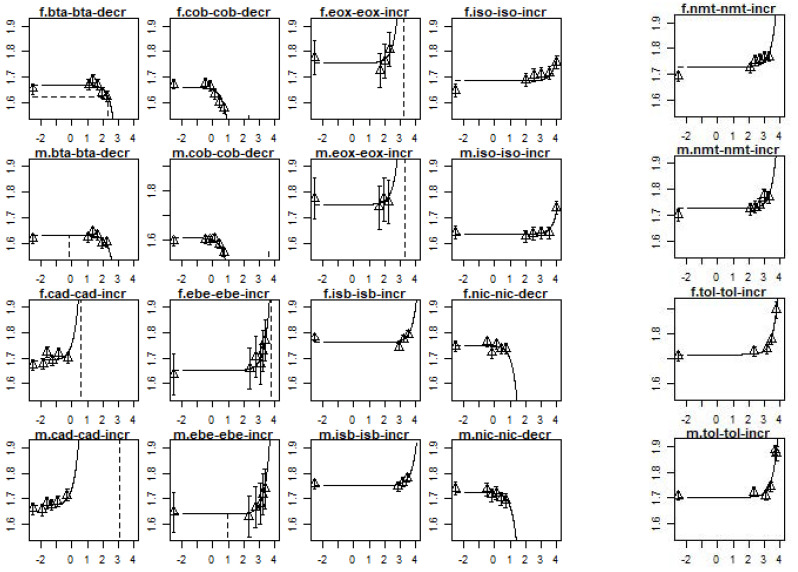
Figure A1.
Dose–response curves for the changes in relative liver weight per compound and sex. The x-axis represents the dose in mg/kg bw/day and the y-axis represents the relative liver weight increase in mg organ weight/g body weight, both on a log10-scale. In the header of each plot, m stands for males and f stands for females. The full chemical names are provided in Table A2.

