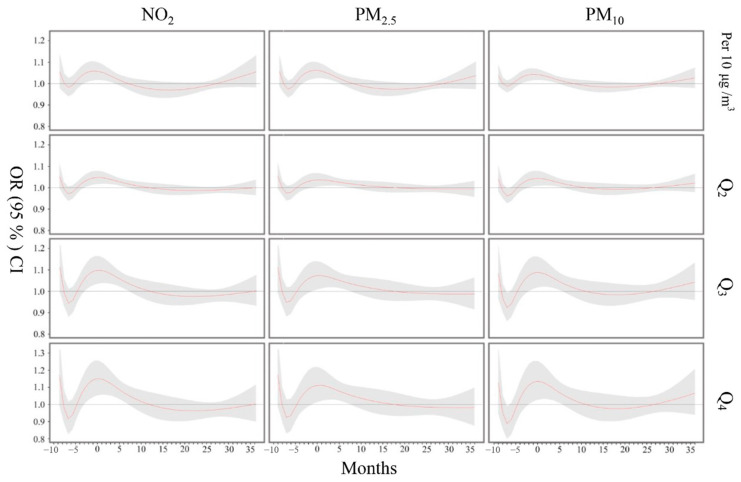
Figure 2.
Odds ratio of child hyperactivity with monthly PM2.5, PM10 and NO2 exposure from fetal period to the first 3 years of life. Note: ORs (95% CI) in the three uppermost charts indicate the risks of PM2.5, PM10 and NO2 for each 10 μg/m3 increment in monthly PM2.5, PM10 and NO2 concentrations during pregnancy. ORs (95% CI) in the other charts indicate the risks of PM2.5, PM10 and NO2 for the second (Q2), third (Q3) and fourth quartiles (Q4) of monthly PM2.5, PM10 and NO2 concentrations from the fetal period to the first 3 years of life compared with the first quartile (Q1) as the reference. Zero in the x-axis scale indicates the time of birth, minus numbers indicate the weeks prior to birth and plus numbers indicate the postnatal months. All models were adjusted for monthly mean ambient temperature, household air pollution conditions, child sex and age, maternal and paternal ages at birth, maternal and paternal education, family income, marital status, parity, multivitamin supplementation during pregnancy, gestational diseases, passive smoking during pregnancy, gestation alcohol consumption, feeding pattern, average daily sleep duration for children and frequencies of parent–child interactive activities at 0–1 and 1–3 years old.

