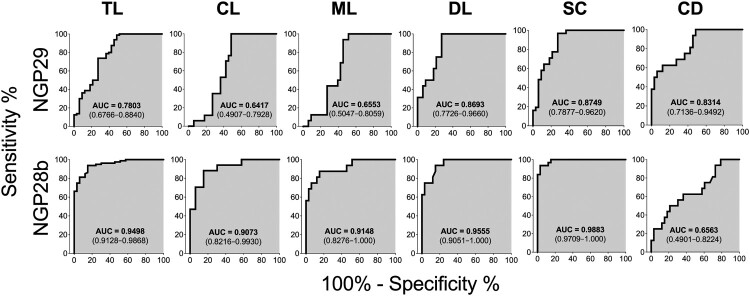
Figure 4.
Receiver-operating characteristic (ROC) curves for NGP29b and NGP28b comparing the reactivity of sera from total TL patients or CL, ML, DL, SC, or CD patients versus control sera from endemic (EC) and nonendemic (NEC) individuals, using cELISA titers normalized to NECs. The area under the curve (AUC) is indicated in the gray area, and 95% confidence interval (CI) values are indicated in parentheses.

