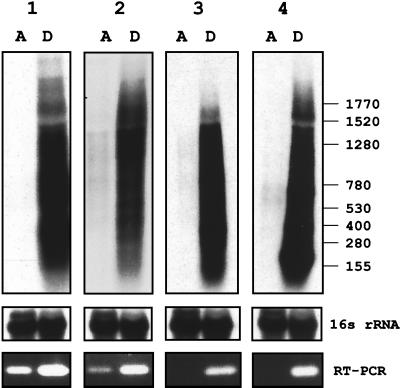
FIG. 3.
Steady-state levels of mRNAs encoding dormancy-induced proteins in growing and dormant cultures. Autoradiograms of Northern blots of total RNA from exponentially growing (lanes A, from time point A in Fig. 1) and hypoxic stationary-phase cultures (lanes D, from time point D in Fig. 1) grown in the Wayne dormancy culture system are shown. The blots were hybridized with [α-32P]dATP-labeled probes specific to the transcripts encoding the dormancy-induced proteins: 1, α-crystallin homolog; 2, 23-kDa response regulator; 3, 32-kDa conserved hypothetical protein; 4, 16-kDa conserved hypothetical protein. X-ray films were exposed for 1 day. Sizes are indicated in bases. 16S rRNA shows the blots after rehybridization with a probe specific to 16S rRNA, demonstrating equal loading of rRNA. Five micrograms of total RNA (prepared from ≈20 ml of culture at time point A and from ≈35 ml of culture at time point D) was loaded. At the bottom, the agarose gel electrophoretic analysis of reverse transcriptase (RT) PCRs carried out with primers specific to the dormancy-induced genes and 150 ng of total RNA is shown. Carrying out the identical reactions but without the reverse transcription step did not yield any bands, demonstrating that the bands generated by reverse transcriptase PCR were derived from RNA and not from contaminating genomic DNA. A control PCR with genomic DNA yielded bands of the same size observed for the reverse transcriptase PCRs. Reverse transcriptase PCRs with primers specific to 16S rRNA yielded bands of the same intensity independent of the RNA sample; thus confirming equal loading of total RNA into the reverse transcriptase reactions (data not shown). All experiments were repeated once, yielding the same results. The values on the right are numbers of nucleotides.

